← Back to projects
Docu Graphics
The North Face: Breaking 20
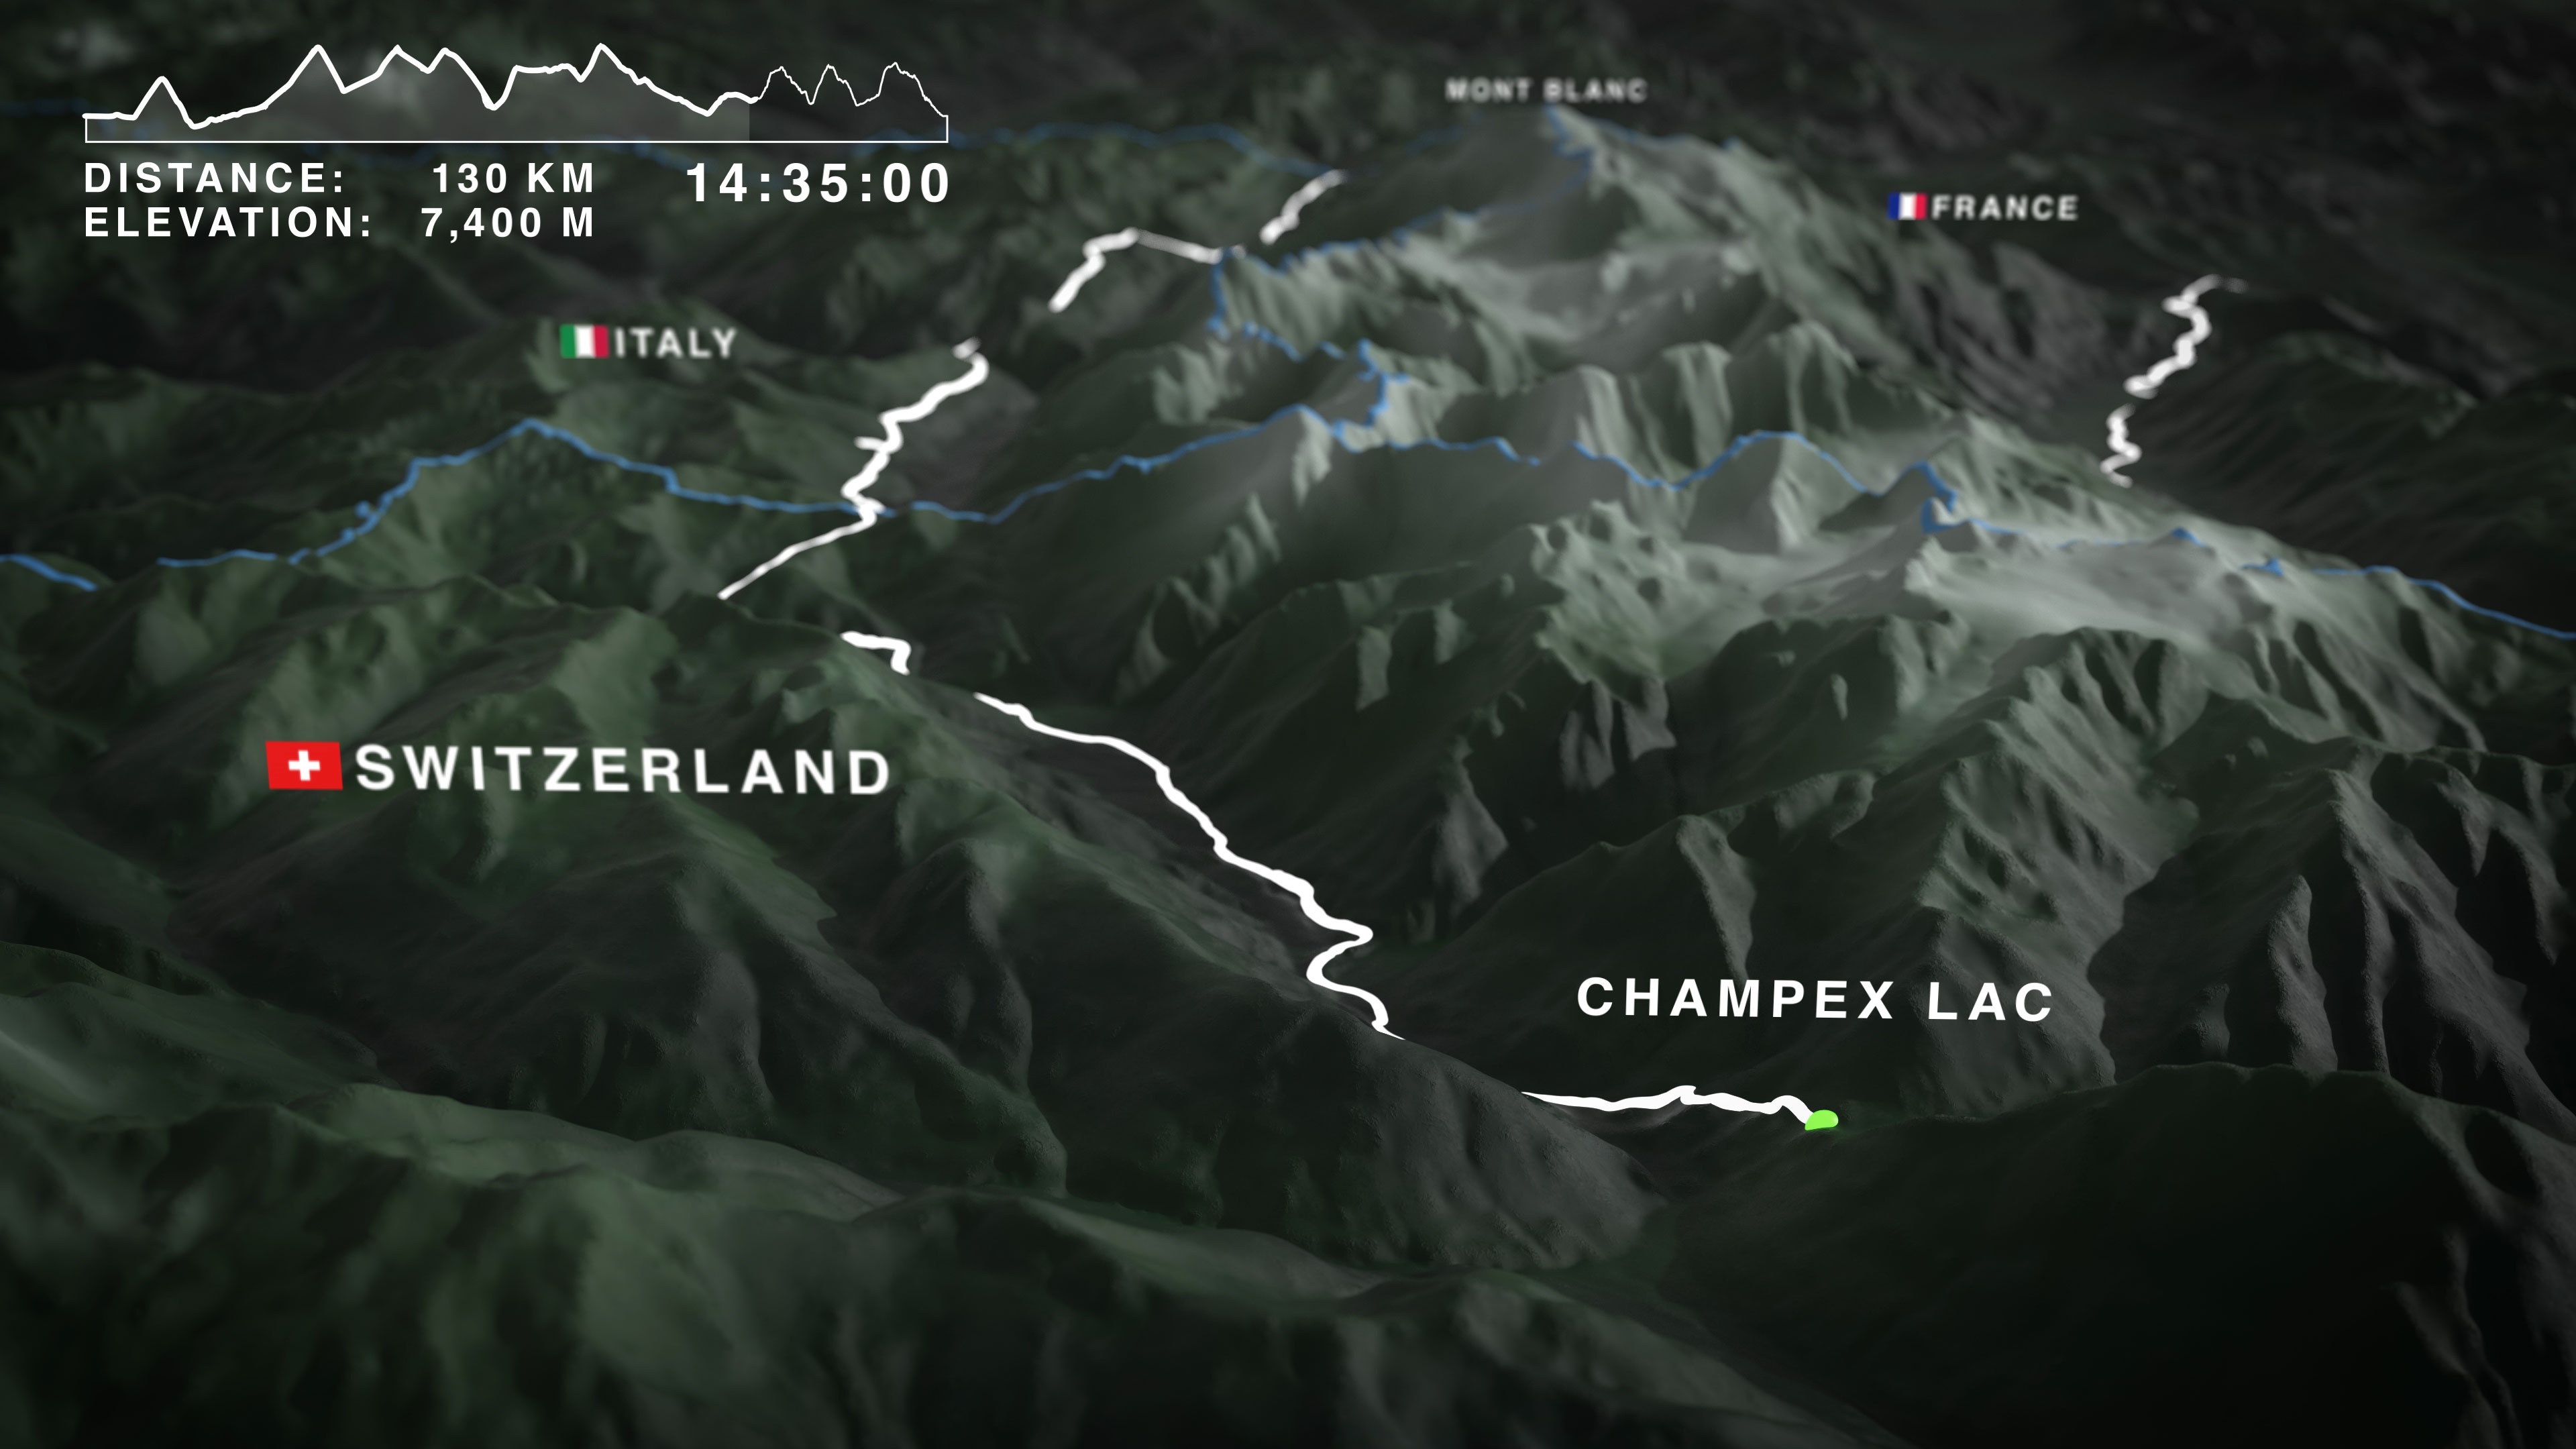
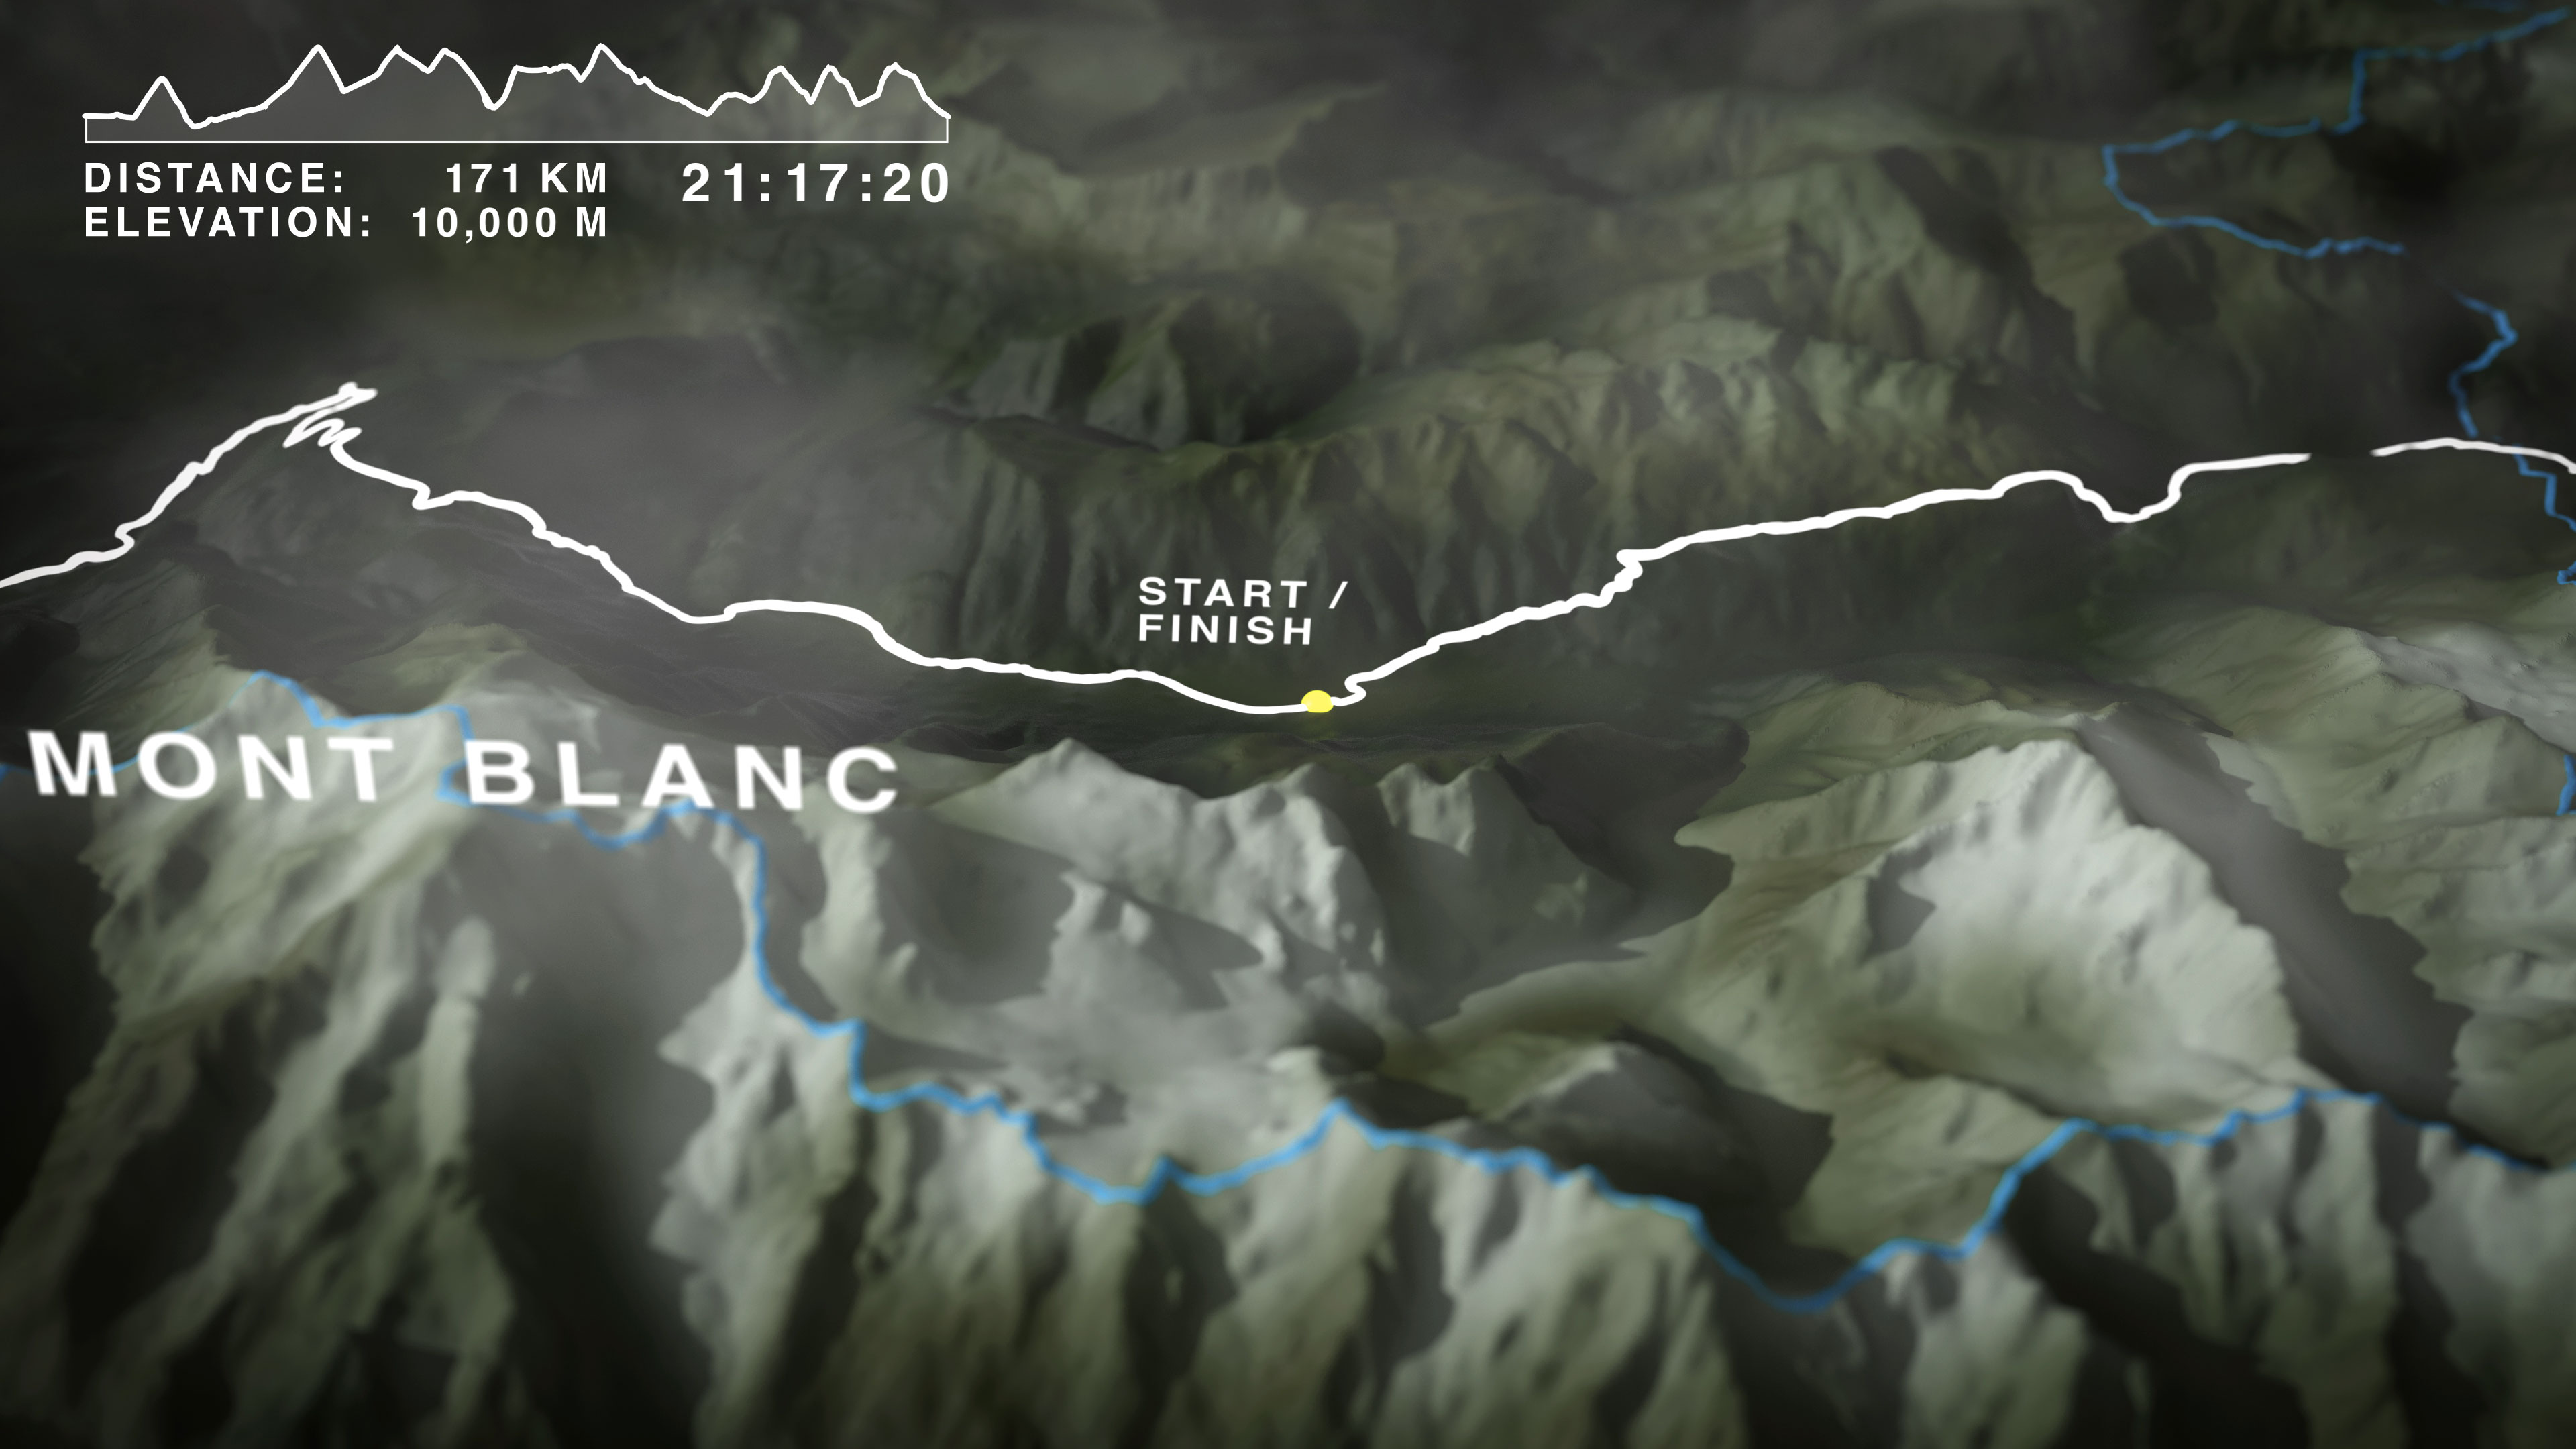
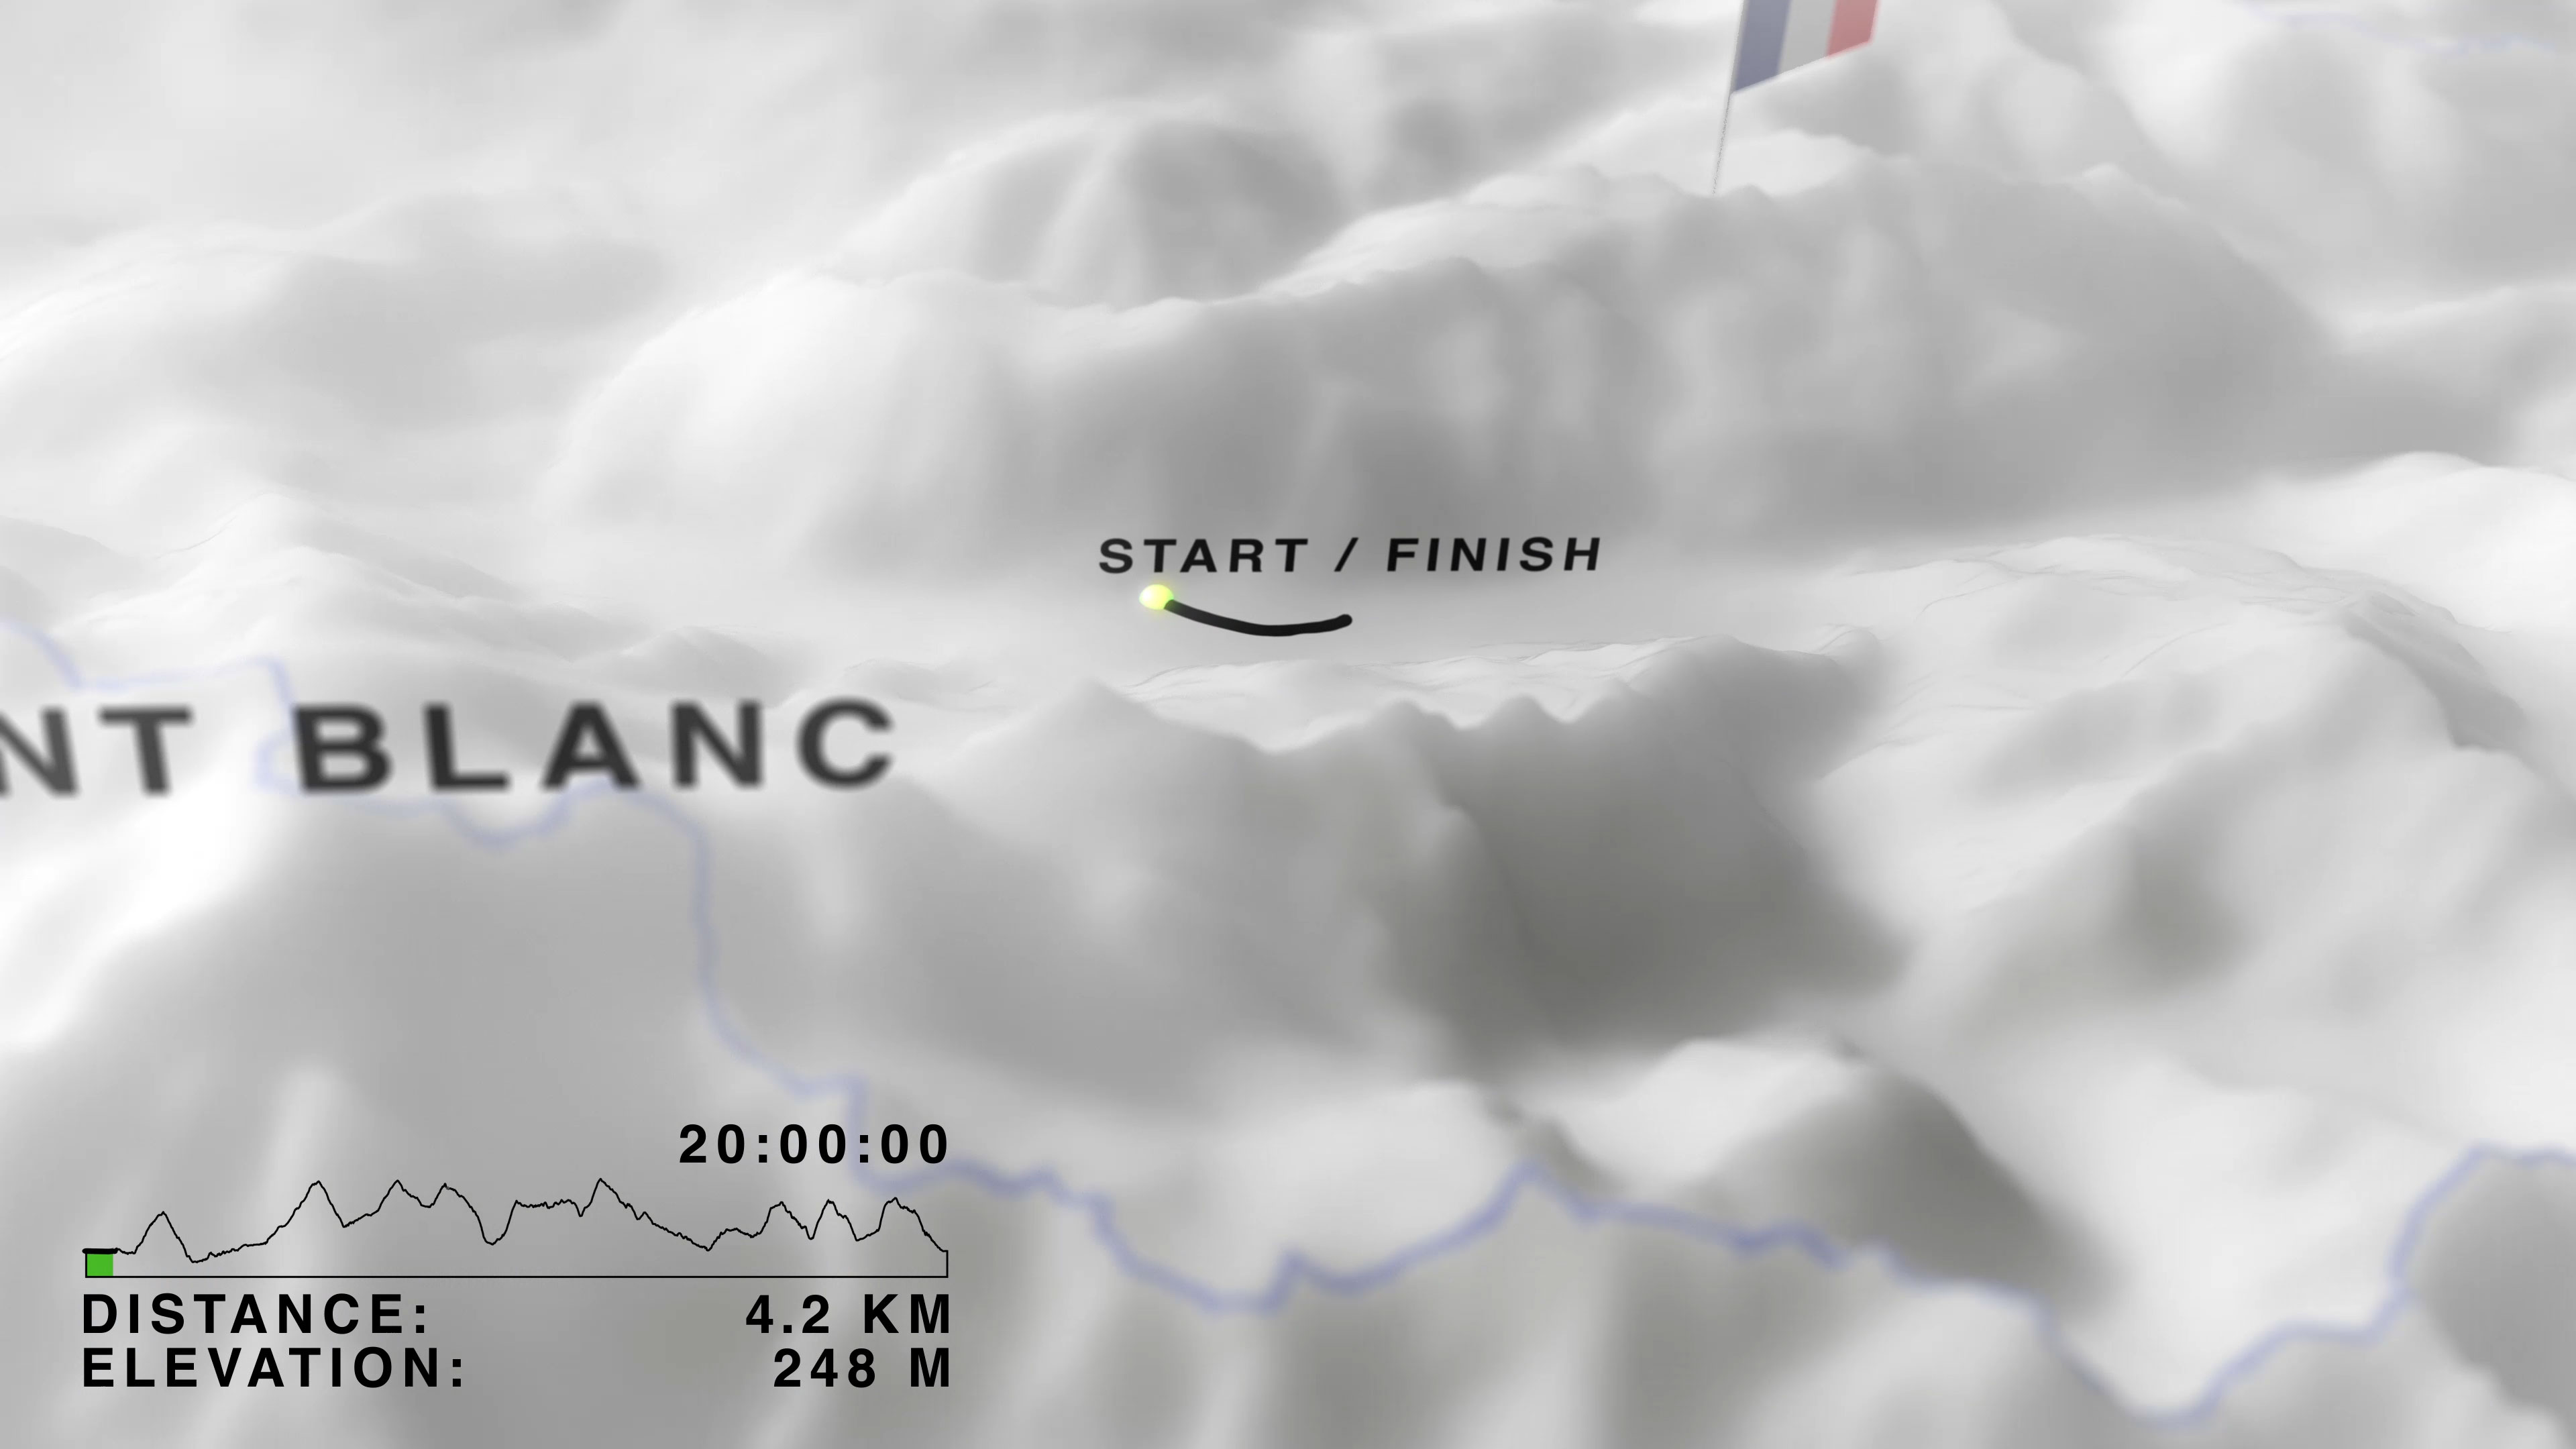
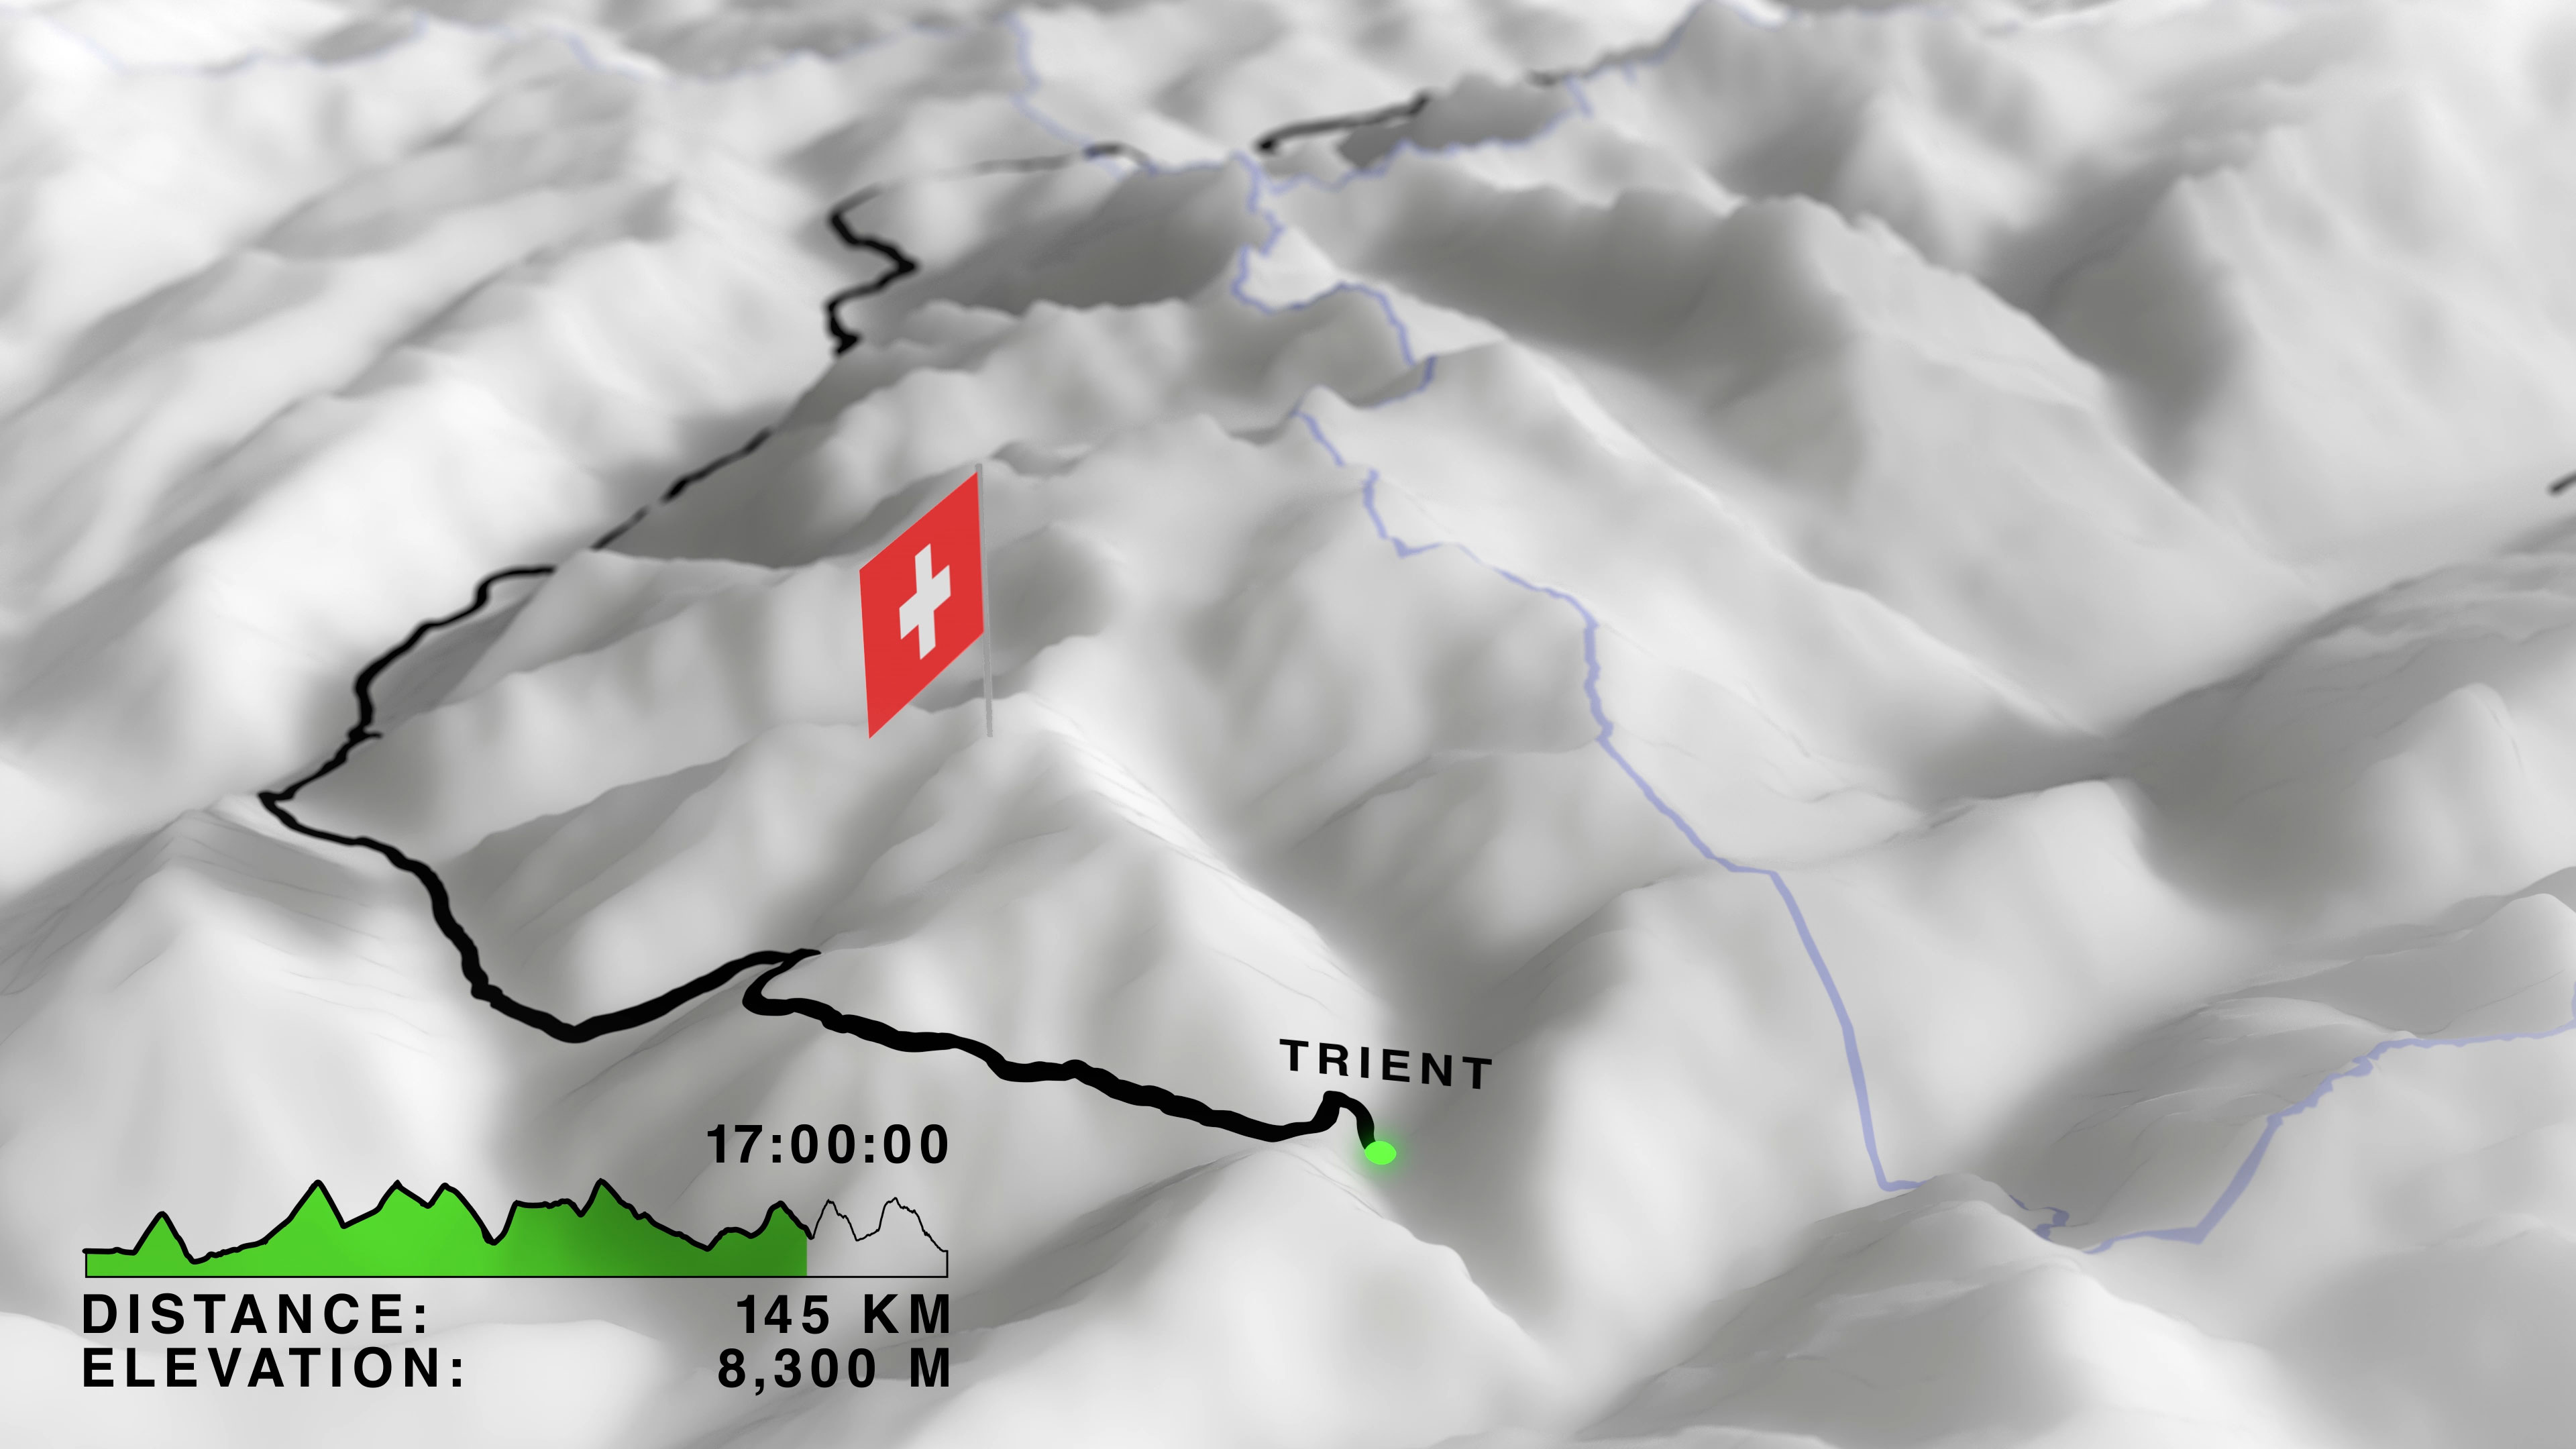
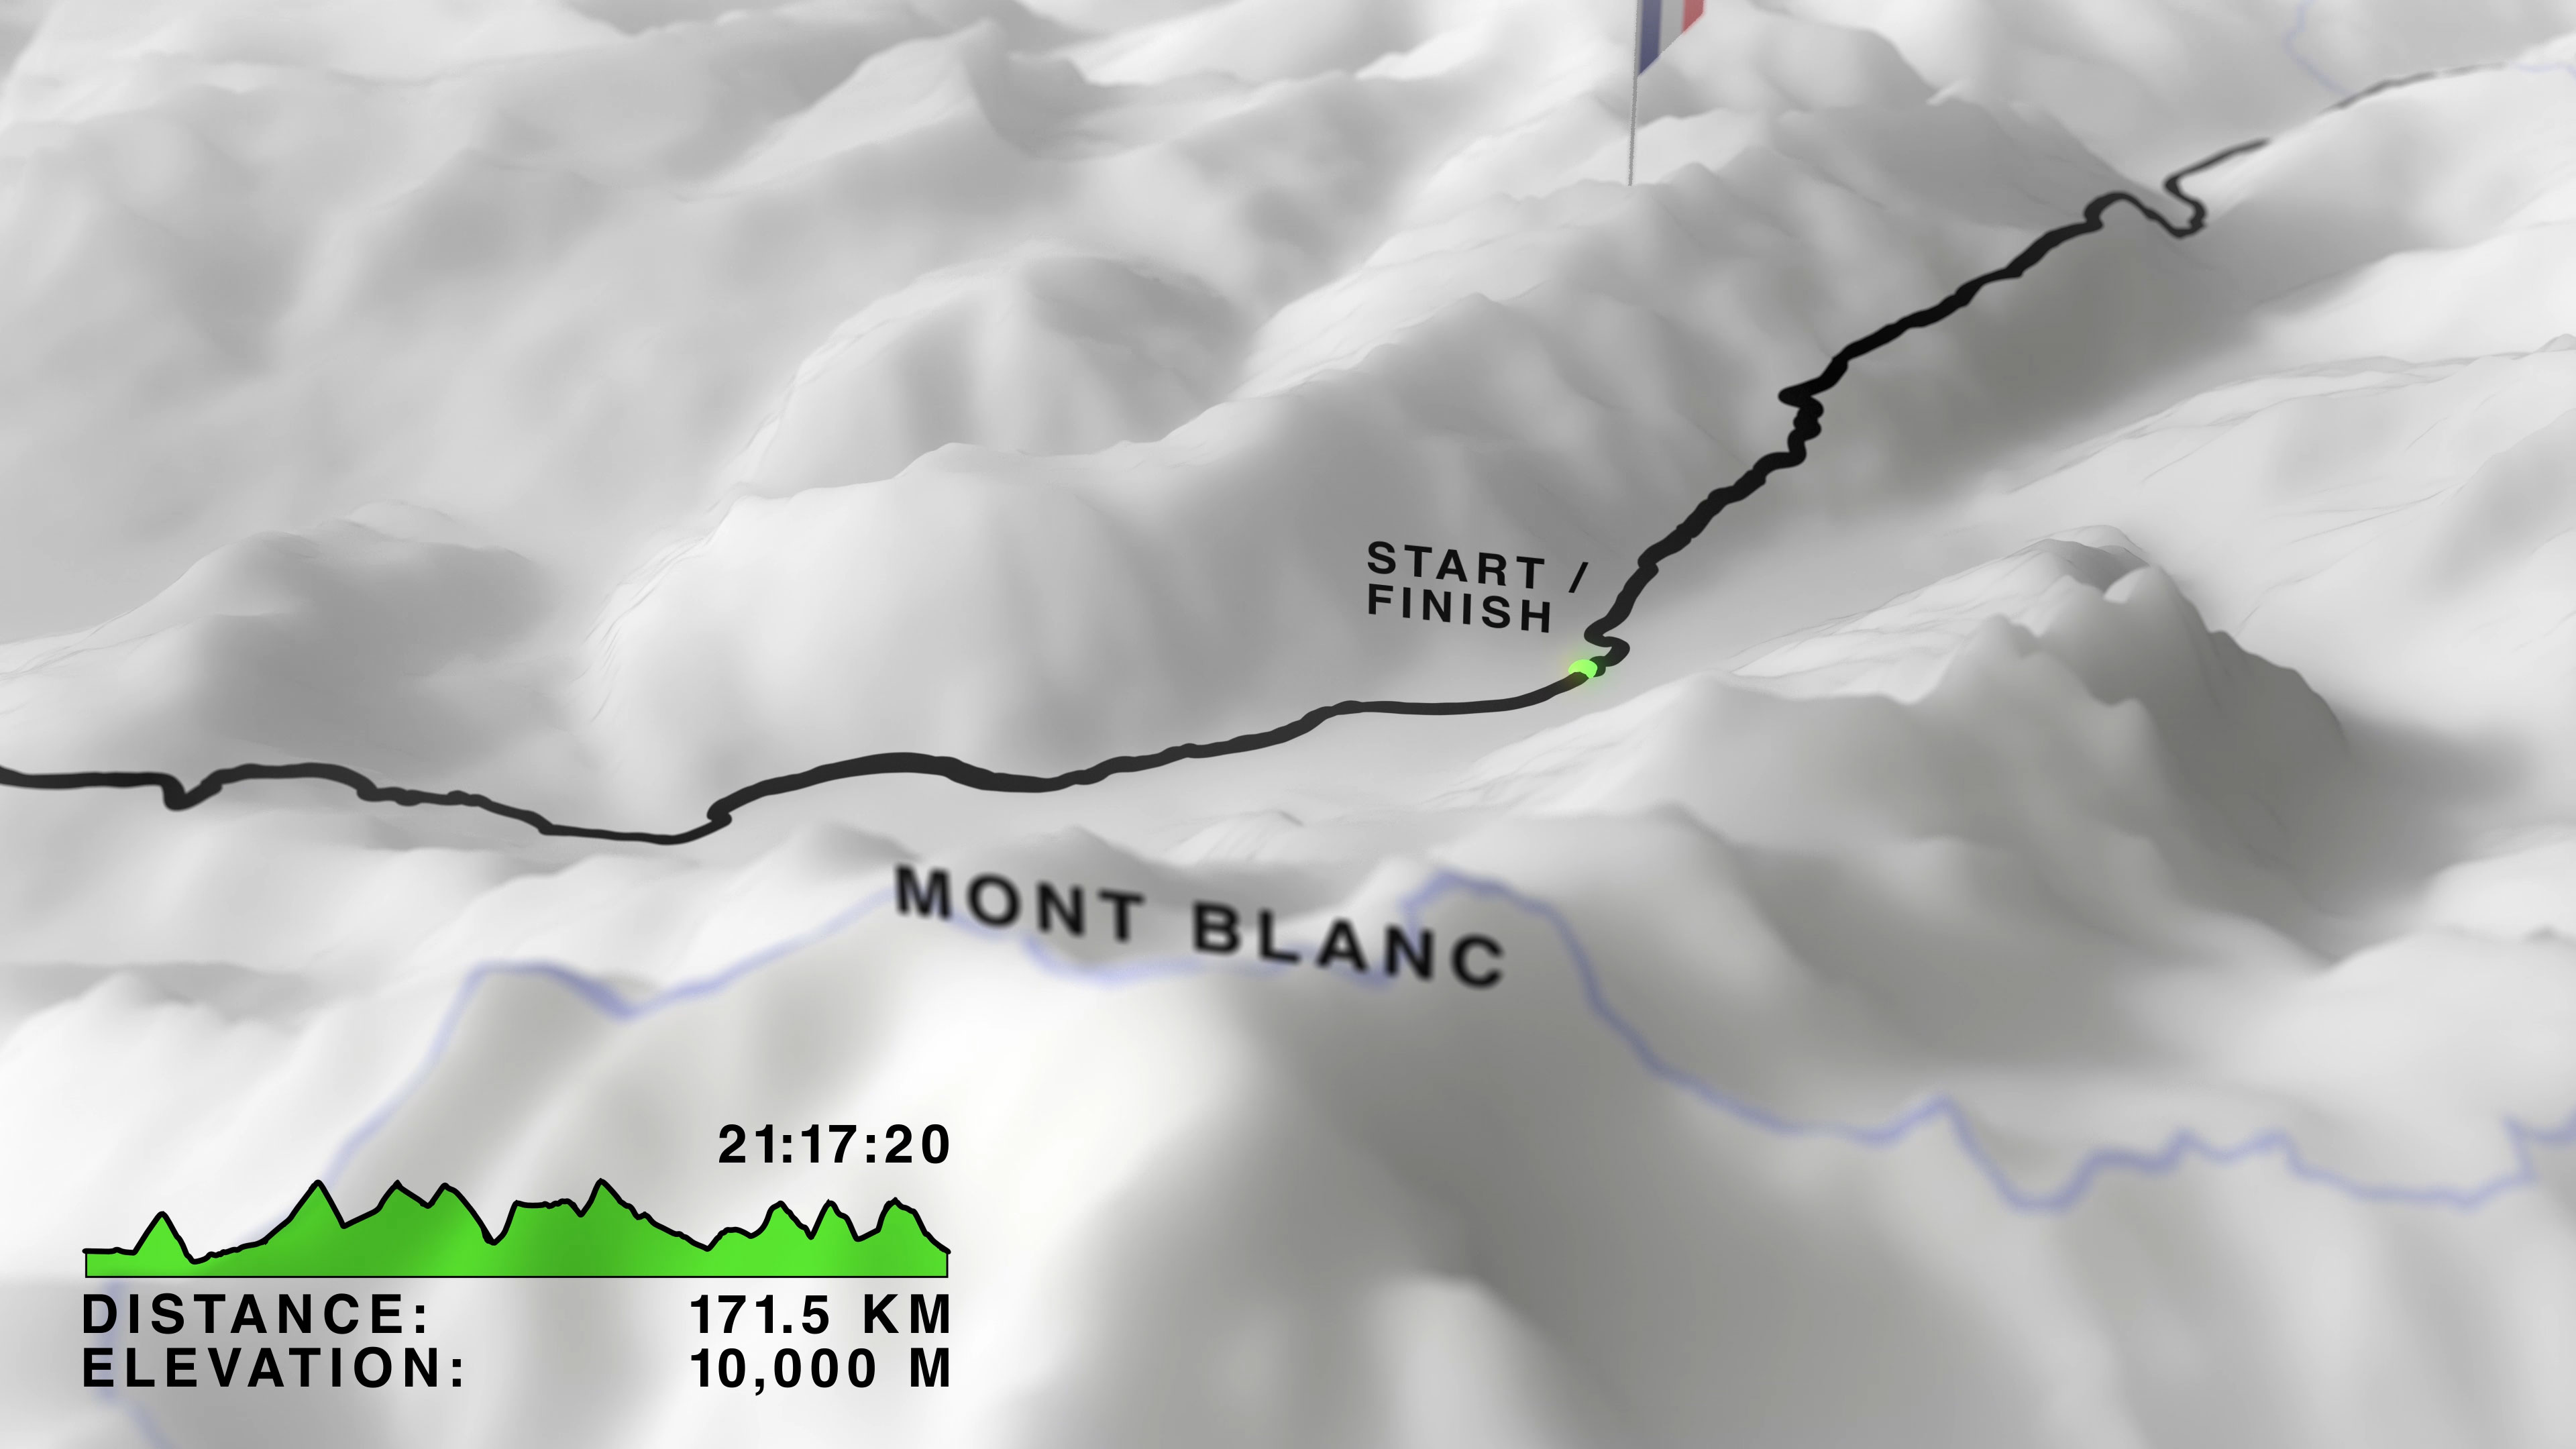
Map animation, data visualization, and timeline graphics for The North Face's Breaking 20, visualizing the ultra-trail race against time.
Motion
Visualizing an ultra-trail race against time.
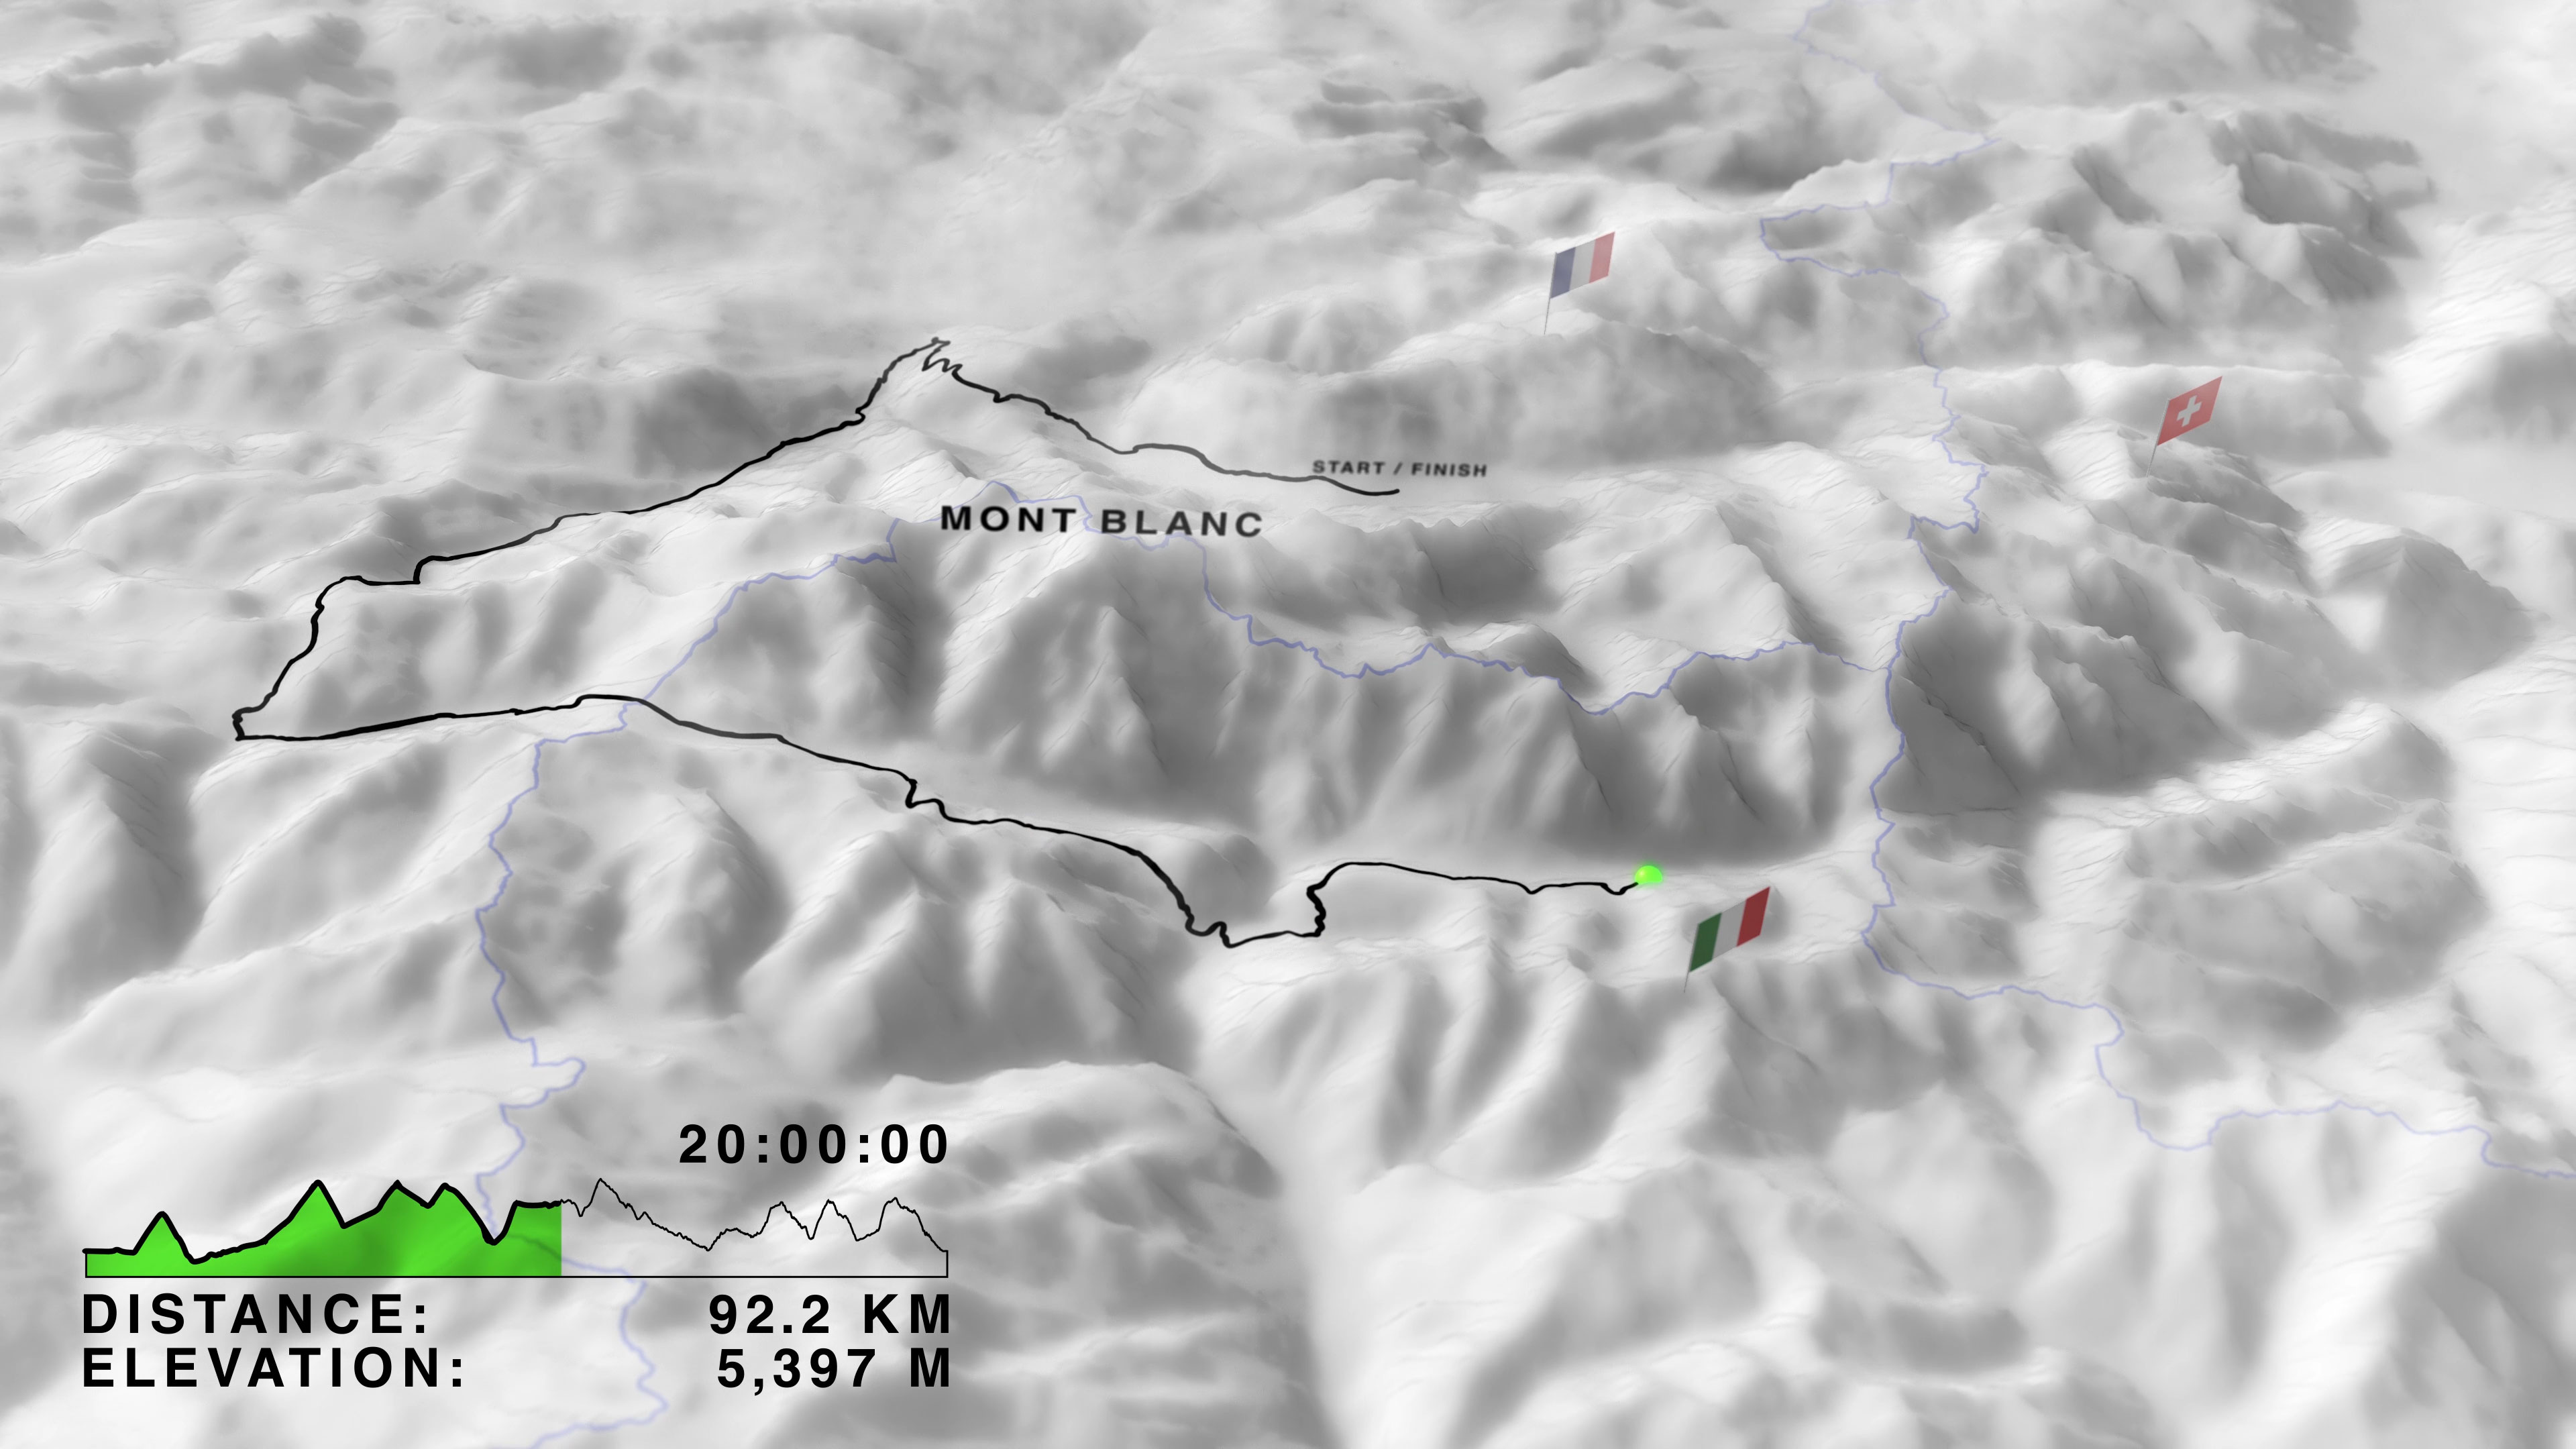
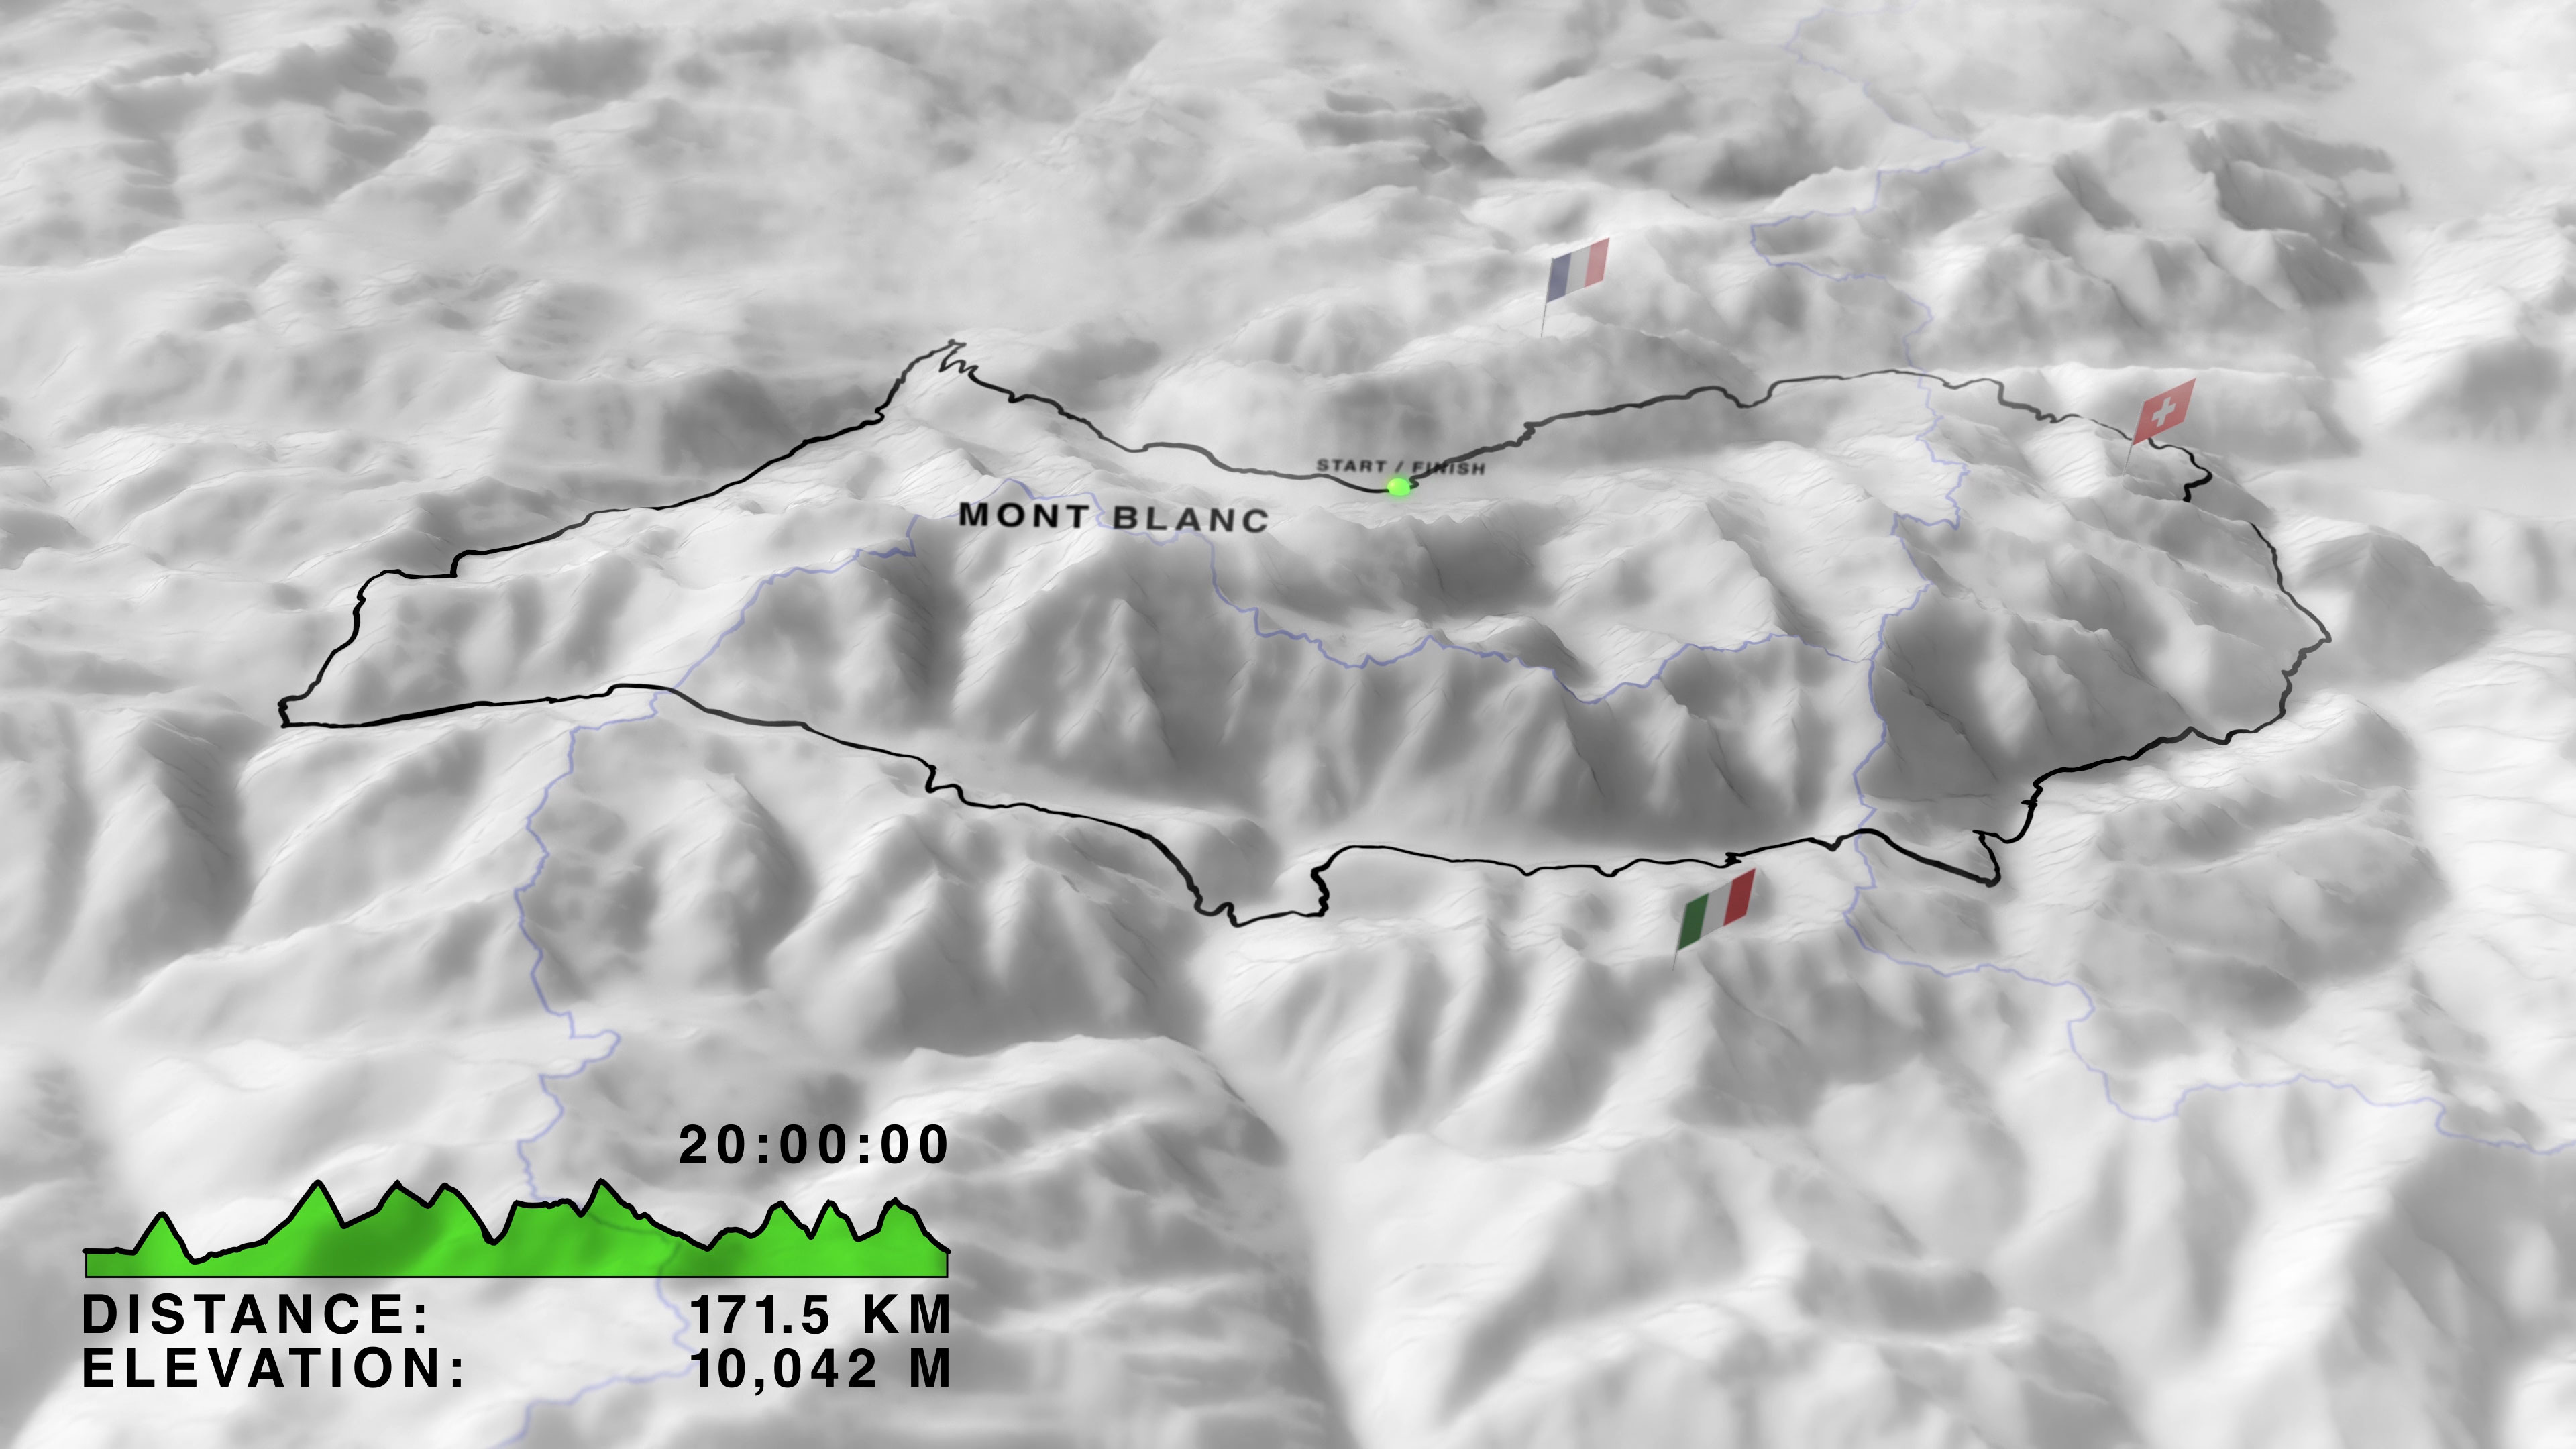
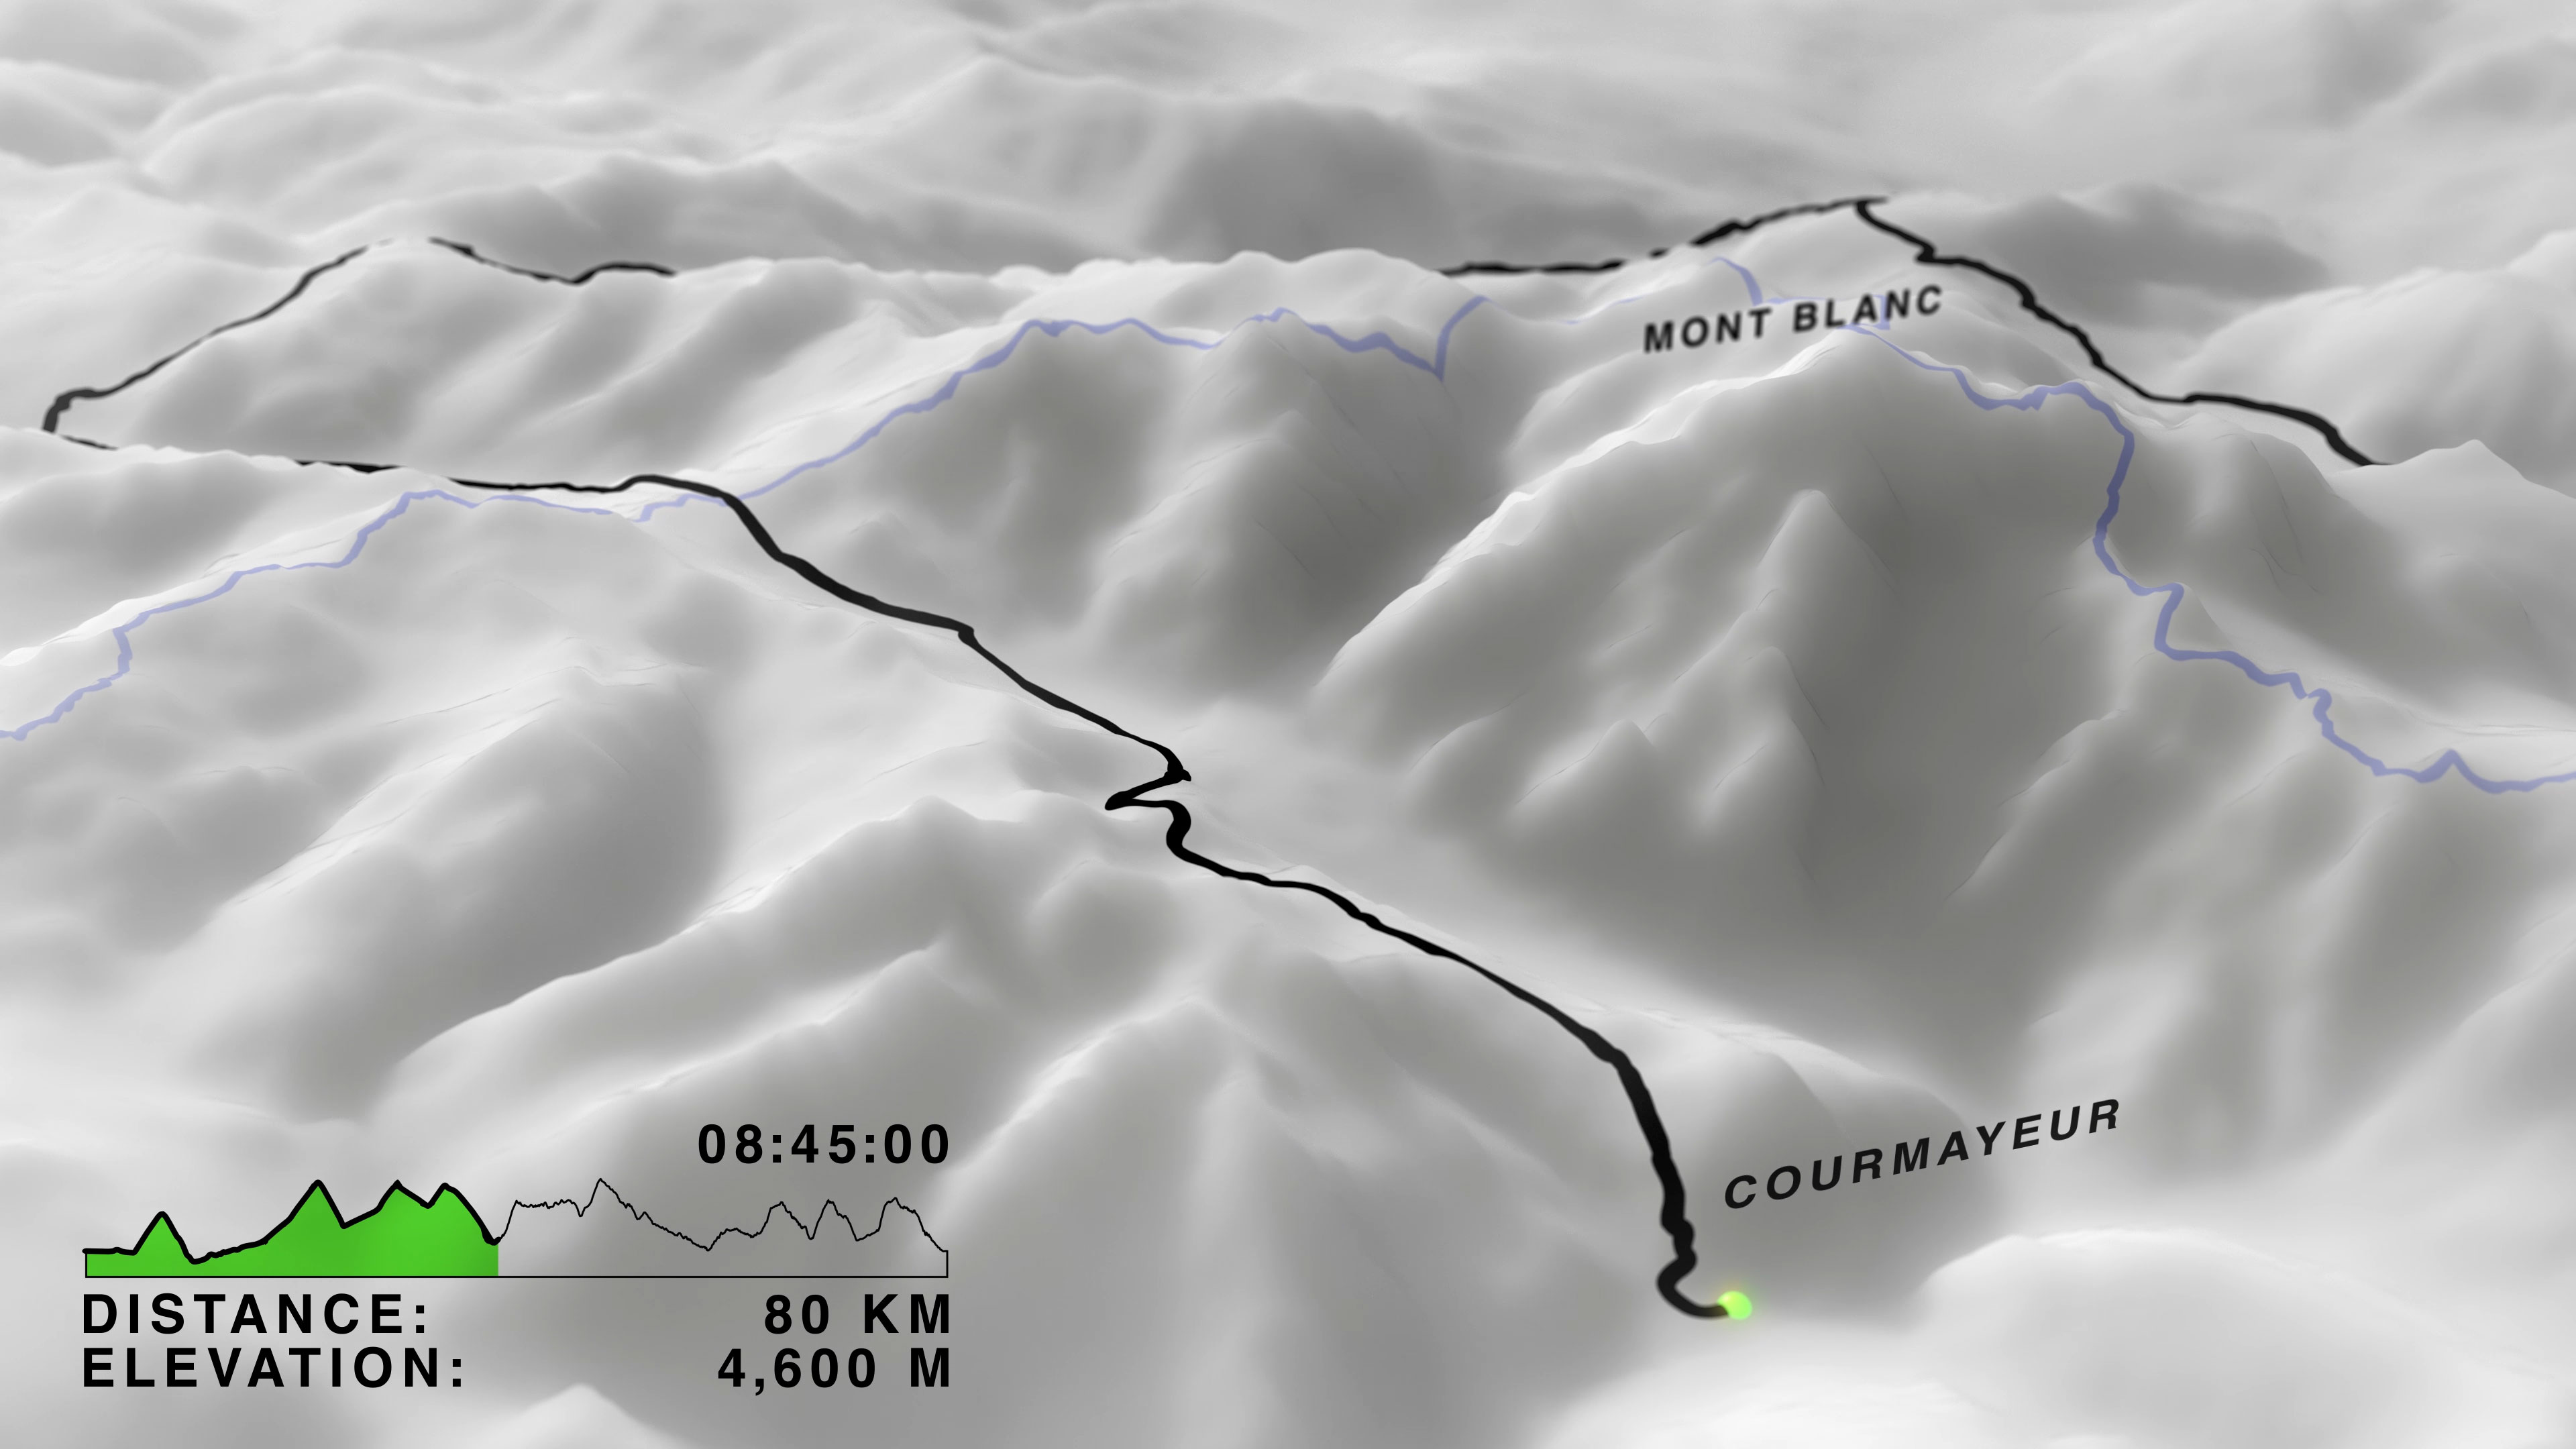
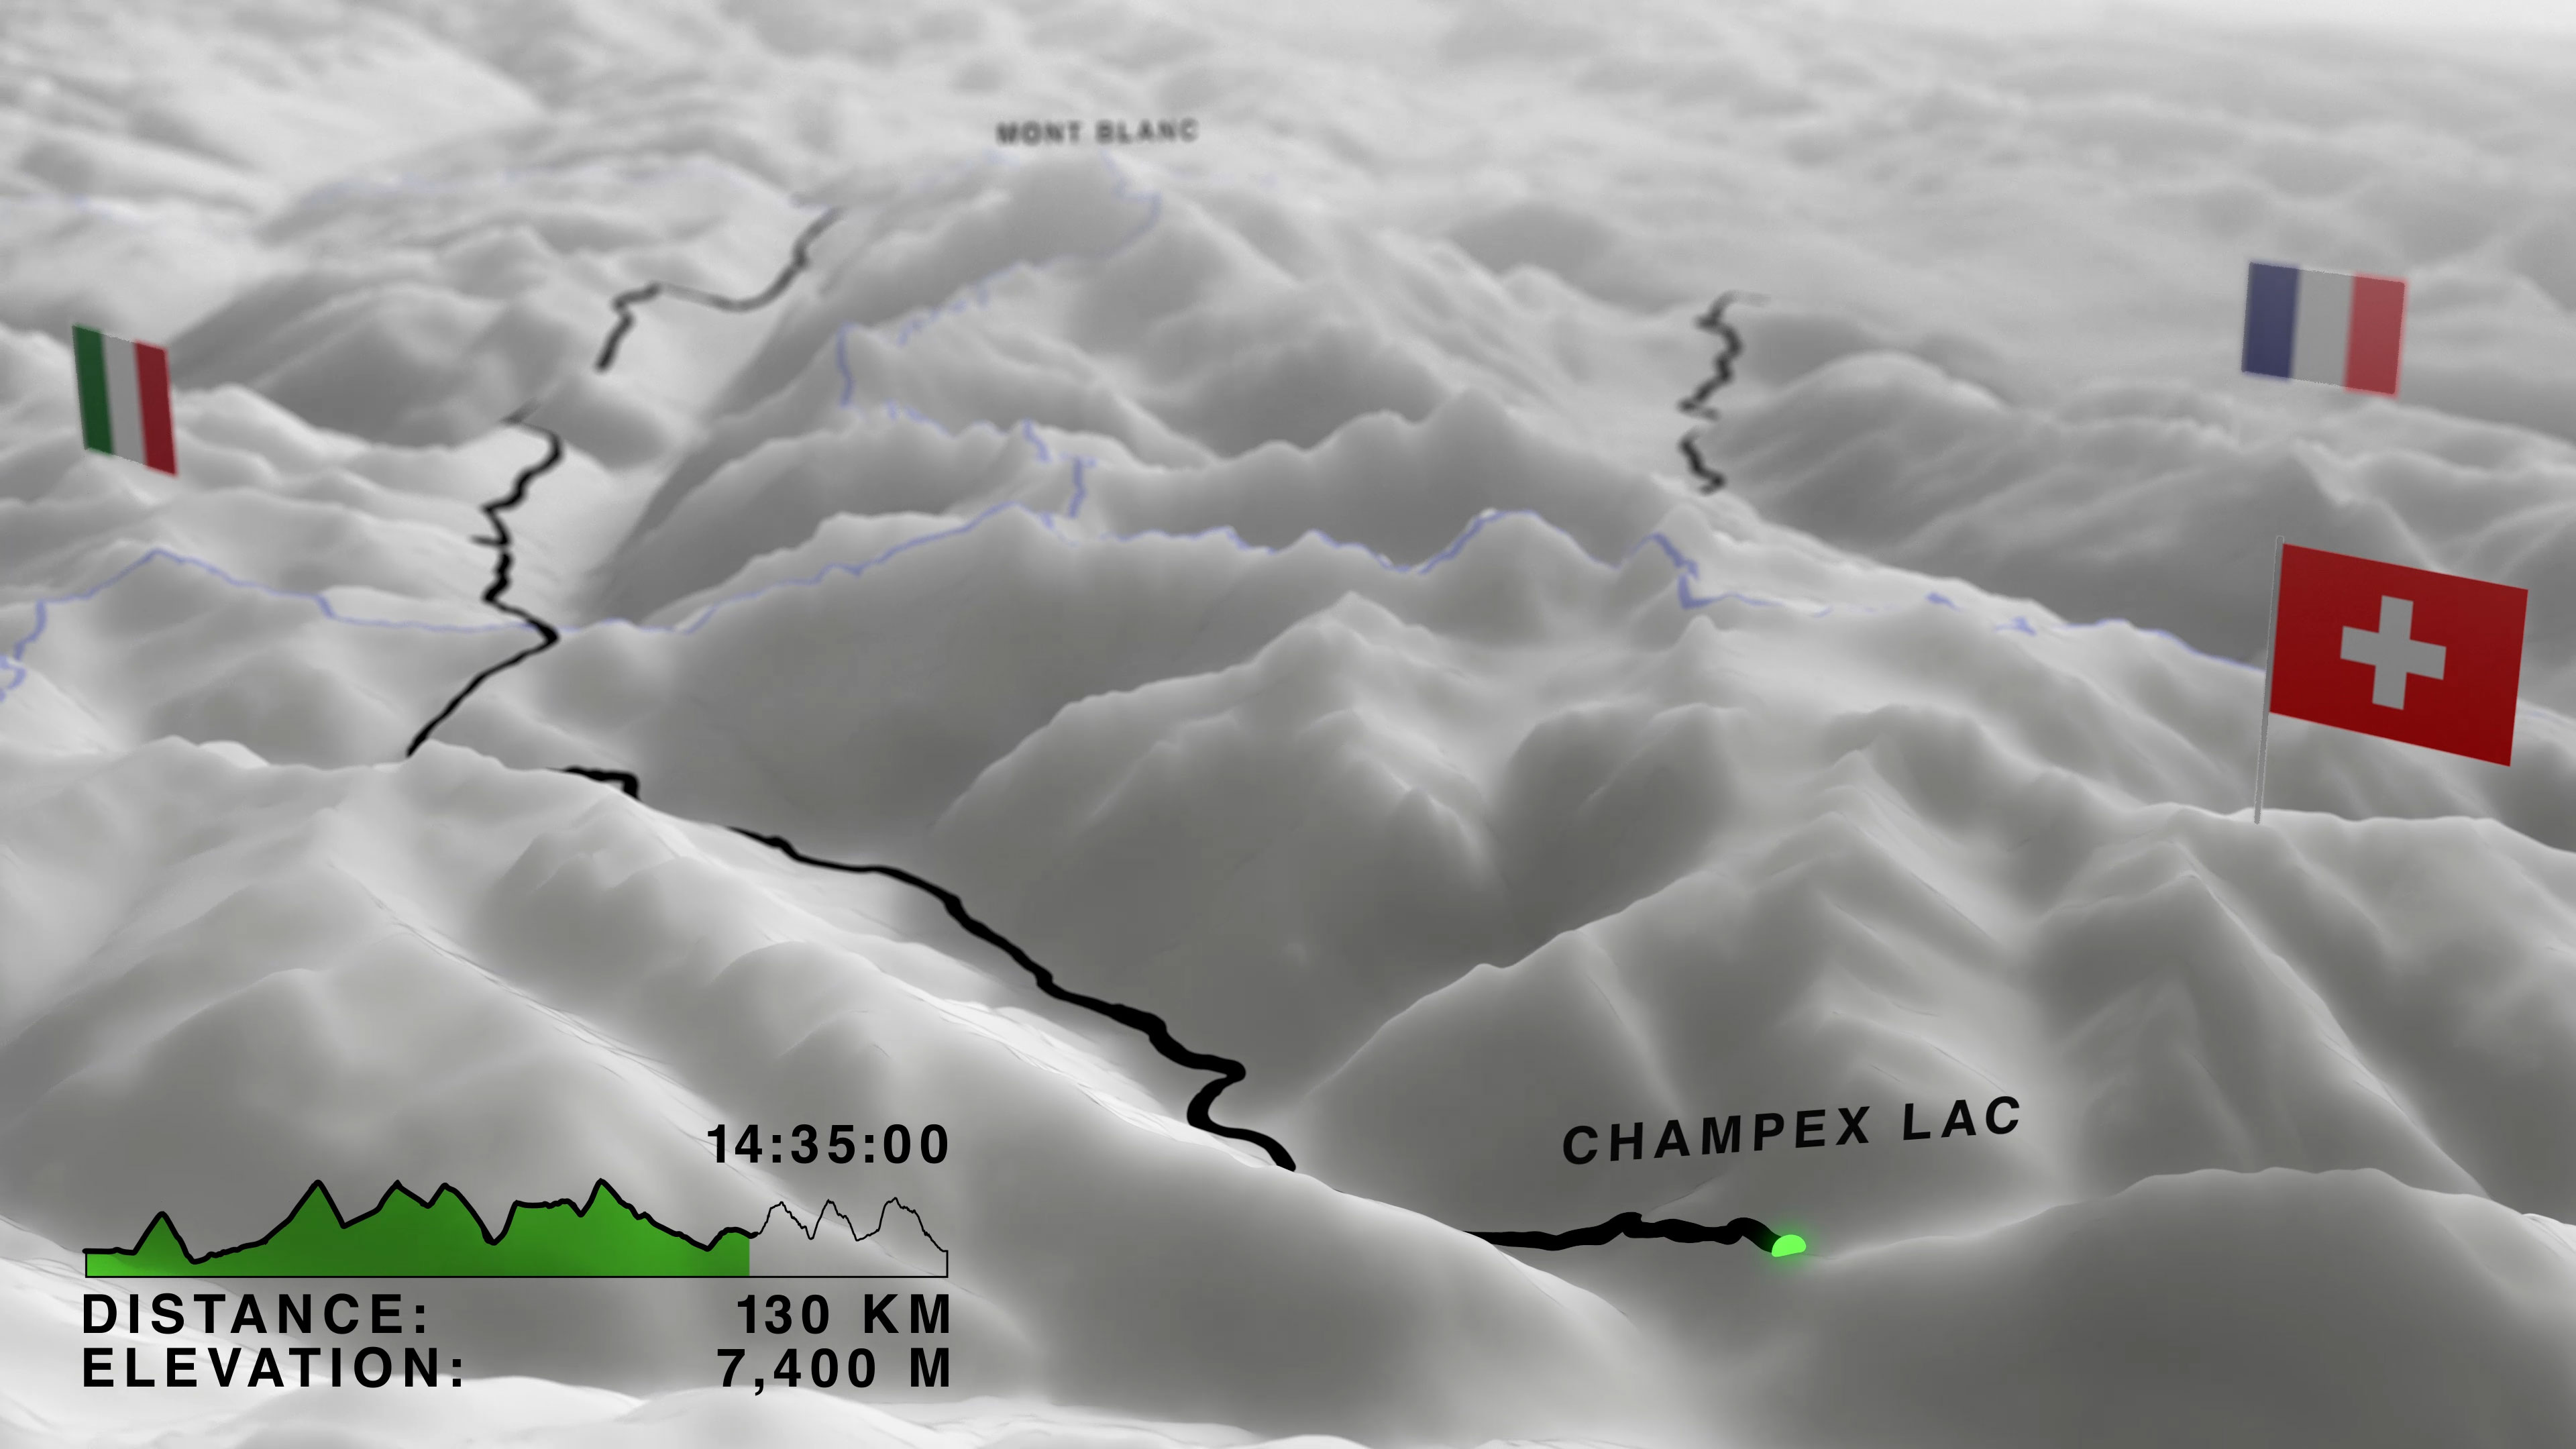
Map animation, data visualization, and timeline graphics tracking the ultra-trail for The North Face's Breaking 20. For The North Face, we built documentary graphics, map animation, data visualization around the parts of the story that are hardest to capture directly. The result is a clearer way to understand the work across film and documentary audiences.
Documentary Graphics
Map Animation
Data Visualization
Timeline Graphics
Clearer Story Geography
A race against time is a data story. Maps, timelines, and visualization made every mile and minute count.
Hero Image 1
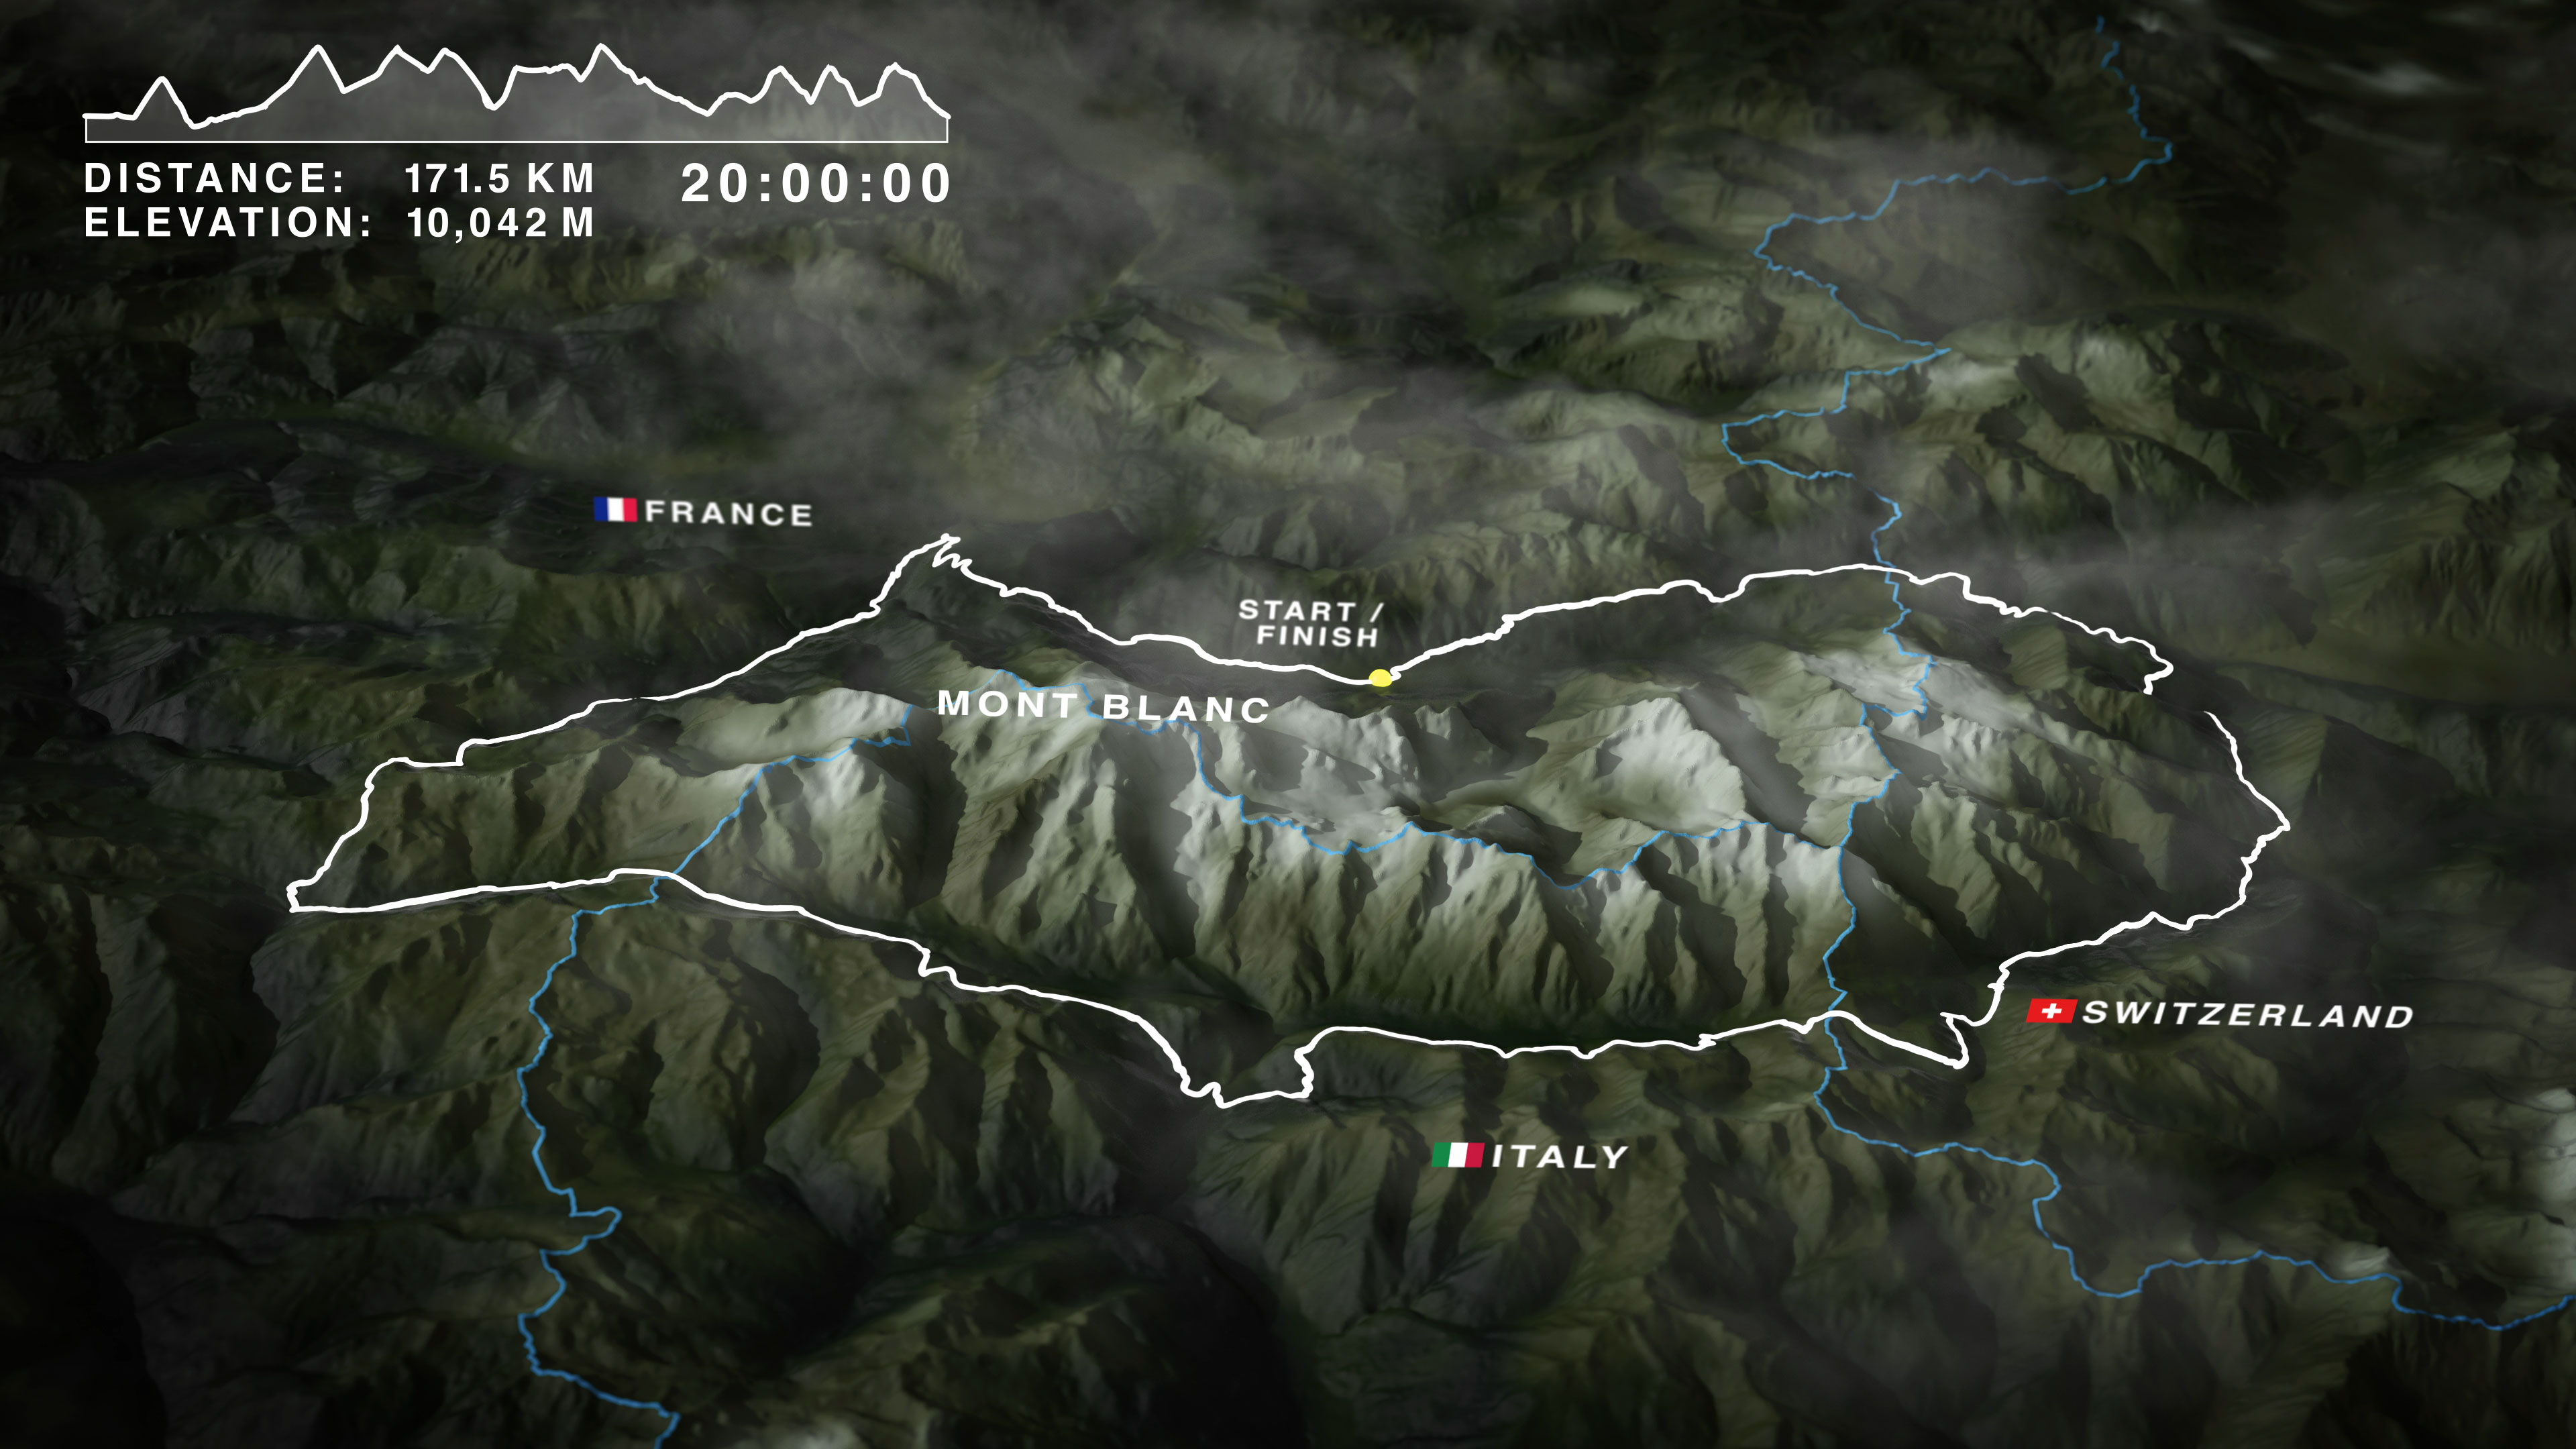
Image Gallery - 2 column
Breakdown gallery - 2 column
Rendered from Cloudflare D1 CMS · updated 2026-07-07 20:48:35